Don’t start 2018 without catching up on the data from this year
You can measure the year in top songs, top movies, or top recipes, taking a look at what made this year “special” using data. But what was special about the data of this year? We’re taking a look at the biggest trends that we found in 2017 using data, and using it to figure out what the big questions will be in 2018.
Mobile readers don’t act like desktop readers
Mobile readers don’t just see a different UI, they interact with content in an entirely different context. An example that we shared in early 2017 showed that mobile readers stayed consistent throughout the week. Or, as Sara Fischer of Axios put it: “desktop dies on weekends.”
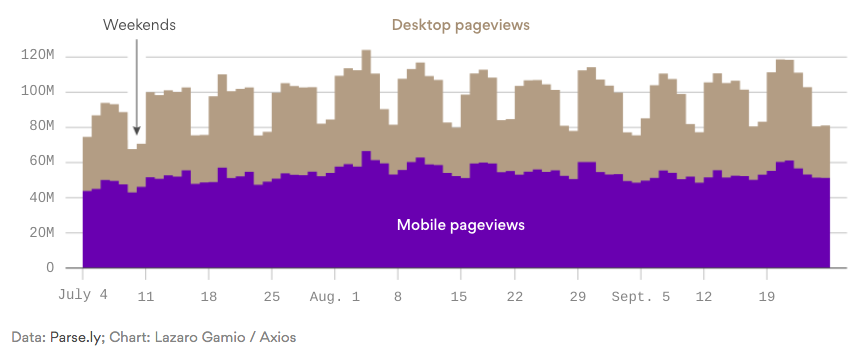
While the ratio of mobile to desktop traffic remains around 1:1 during the week, it’s closer to 2:1 on the weekends. The mobile ratio also increases late at night, with an 11:00pm EST “reading activity peak.”
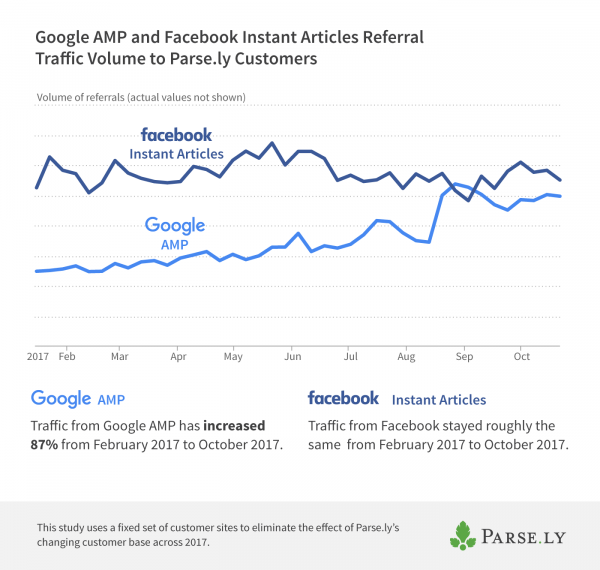
People also find articles in different ways when they use mobile. Facebook and Google both still dominate on mobile, but AMP and Facebook Instant came into sharper focus in 2017.
Beyond those sources, when you narrow the scope to mobile only, some sites stand out as powerful referrers. Flipboard proved to be one such example. While it doesn’t make the overall list of top external referrers to Parse.ly’s network, Flipboard brings the fourth most mobile-only referrers, as measured by pageviews.
What other referral sources will dominate only certain types of traffic, as defined by device type or otherwise in 2018?
Engagement data gets deeper (and useable!)
It’s been a few years since we started to provide engaged time as a metric, and this year we had enough data on it to really dive into what it means, and how it can be used better by content providers. First, we looked at how visitors find and engage with different content formats on publishers’ sites, as measured by engaged time.
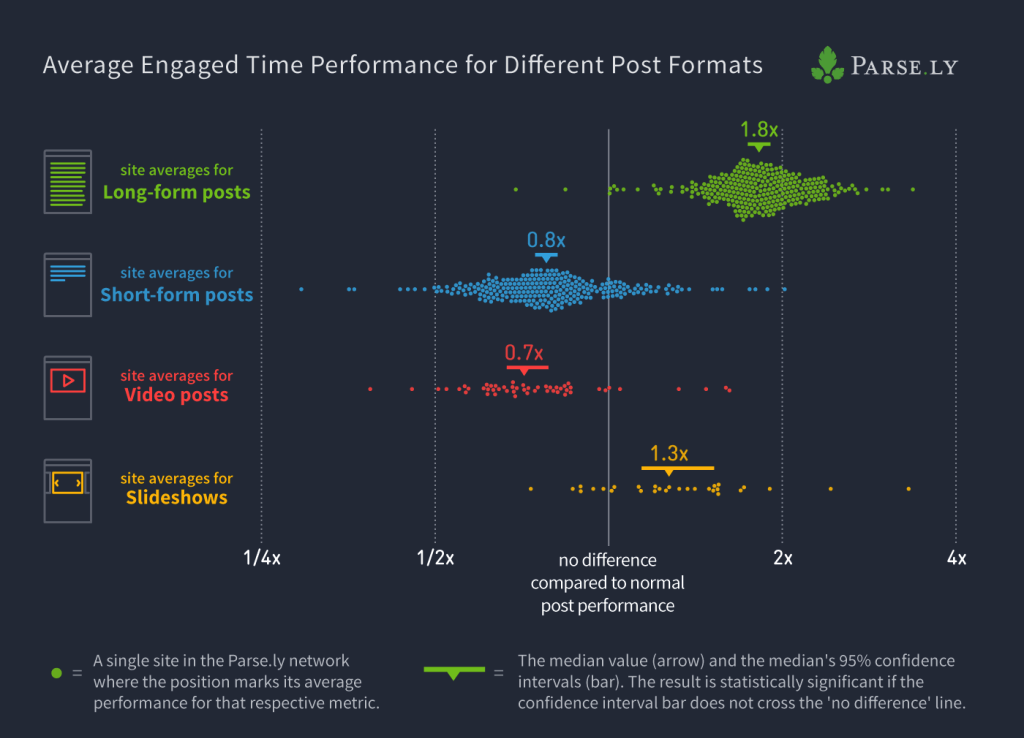
When comparing engagement across post formats, long-form content was almost twice as engaging as short-form posts. On the other end of the spectrum, video was the least engaging of the four formats studied. This data may explain why a number of sites that have decided to go all-in on video haven’t been able to turn that into success.
Engaged time also allows us to rethink individual visits to a page, whether or not they read another article. Traditionally defined as a “bounce,” we examined readers not based on whether they left, but how they engaged with the story they came to read. We defined “bad visits” as those readers that stay under 15 seconds, and took a look at the remaining visits. Of the remaining “good” visits, 44% last over one minute.
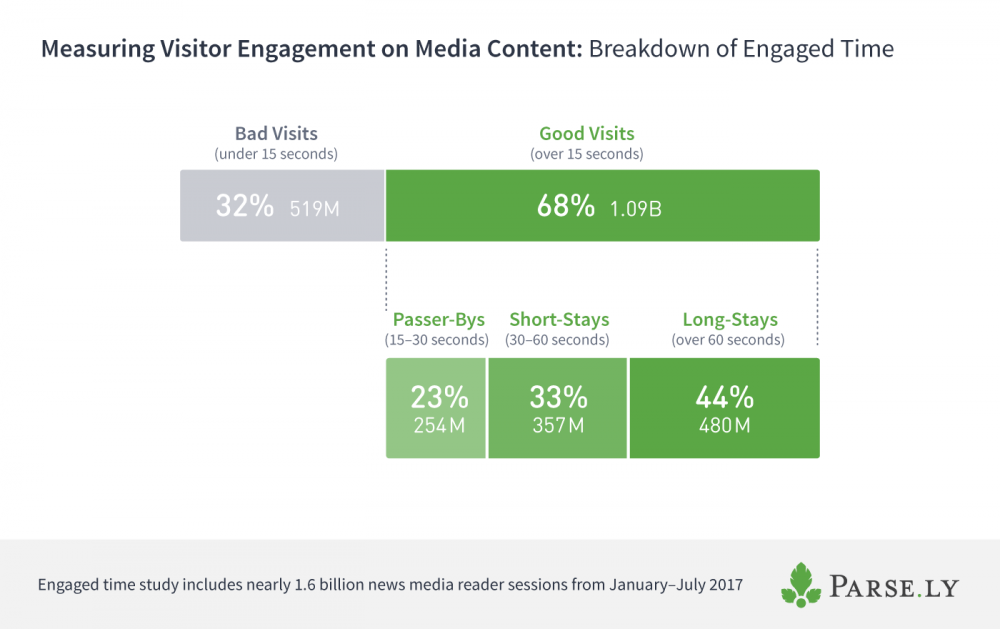
In fact, 50% of visits range from 1 – 7 minutes of engaged time. As Andrew Montalenti said on a recent episode of The Center of Attention, “There’s plenty of audience appetite for scrolling deeply into content.”
Next year, we want to discover more about how to predict these “good” and “bad” visits. What characteristics can we define for each? And more importantly, how do we use that information to reduce the bad ones?
Even if duopoly power dynamics shift, platforms still complicate things
In a Tow Center report about platforms’ influence on journalism, researchers Emily Bell and Taylor Owen write, “In the wake of the election, we have an immediate opportunity to turn the attention focused on tech power and journalism into action.” The industry has ongoing concerns over issues like platforms’ influence over advertising, the spread of fake news, and a need for data and algorithm transparency.
Platform referral traffic witnessed a reversal from 2016: Google returned to the top external traffic position to our network and overtook Facebook.
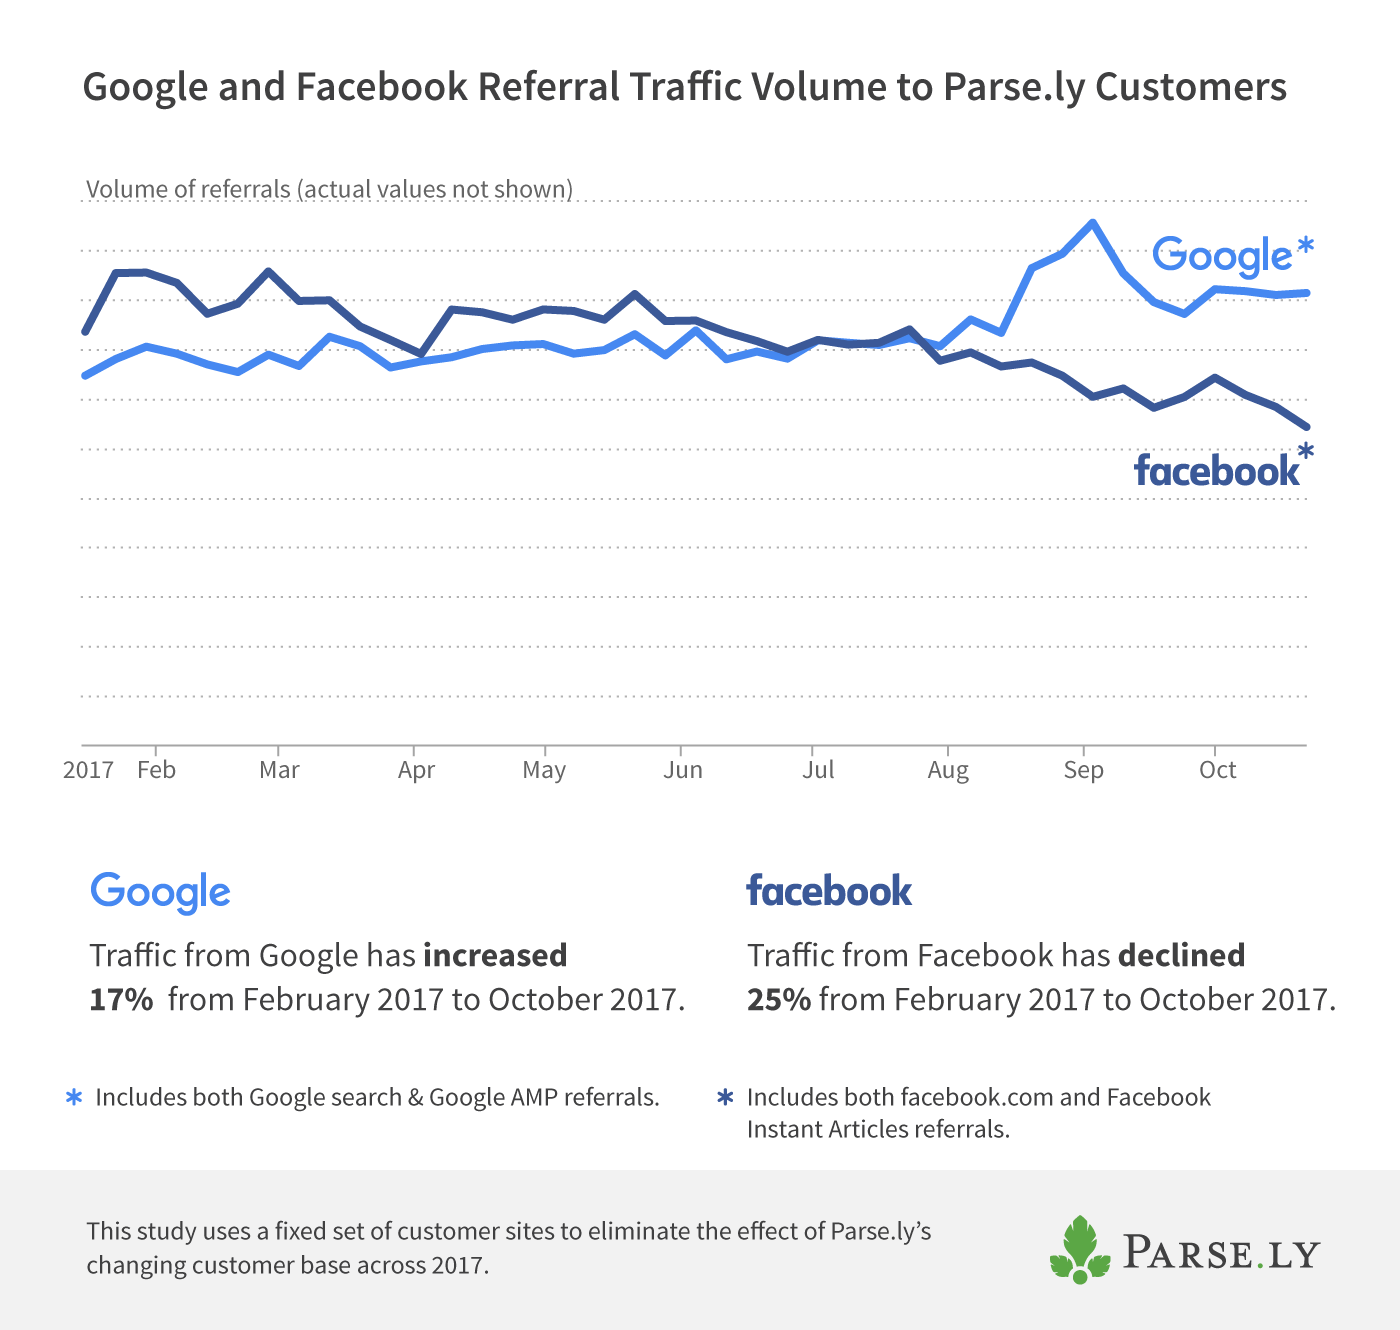
Traffic from Google increased 17% from February to October 2017, while traffic from Facebook declined by 25% over the same time period. Traffic from Google AMP specifically increased by 87%.
What factors could have contributed? Journalists outline a few possibilities, including: updates to Facebook’s news feed algorithm, publishers shifting towards posting native Facebook videos, and traffic from AMP stories. The list only emphasizes how much uncertainty still surrounds Facebook’s algorithm, and how much control that exerts over publishers.
Not all publishers saw an equal amount of Facebook traffic decrease; some even experienced an increase over the same time period. The median site in our network, though, saw a 20% decline in Facebook traffic. For publishers who rely heavily on Facebook referral traffic, this could be cause for concern.
The de-aggregation of content data at a topic level
While we do focus on the high level trends from these platforms, we learned that the way audiences find articles online—particularly through Google or Facebook—varies by topic. For instance, 87% of external traffic to lifestyle articles comes from Facebook, while 60% of traffic to technology articles comes from Google search.
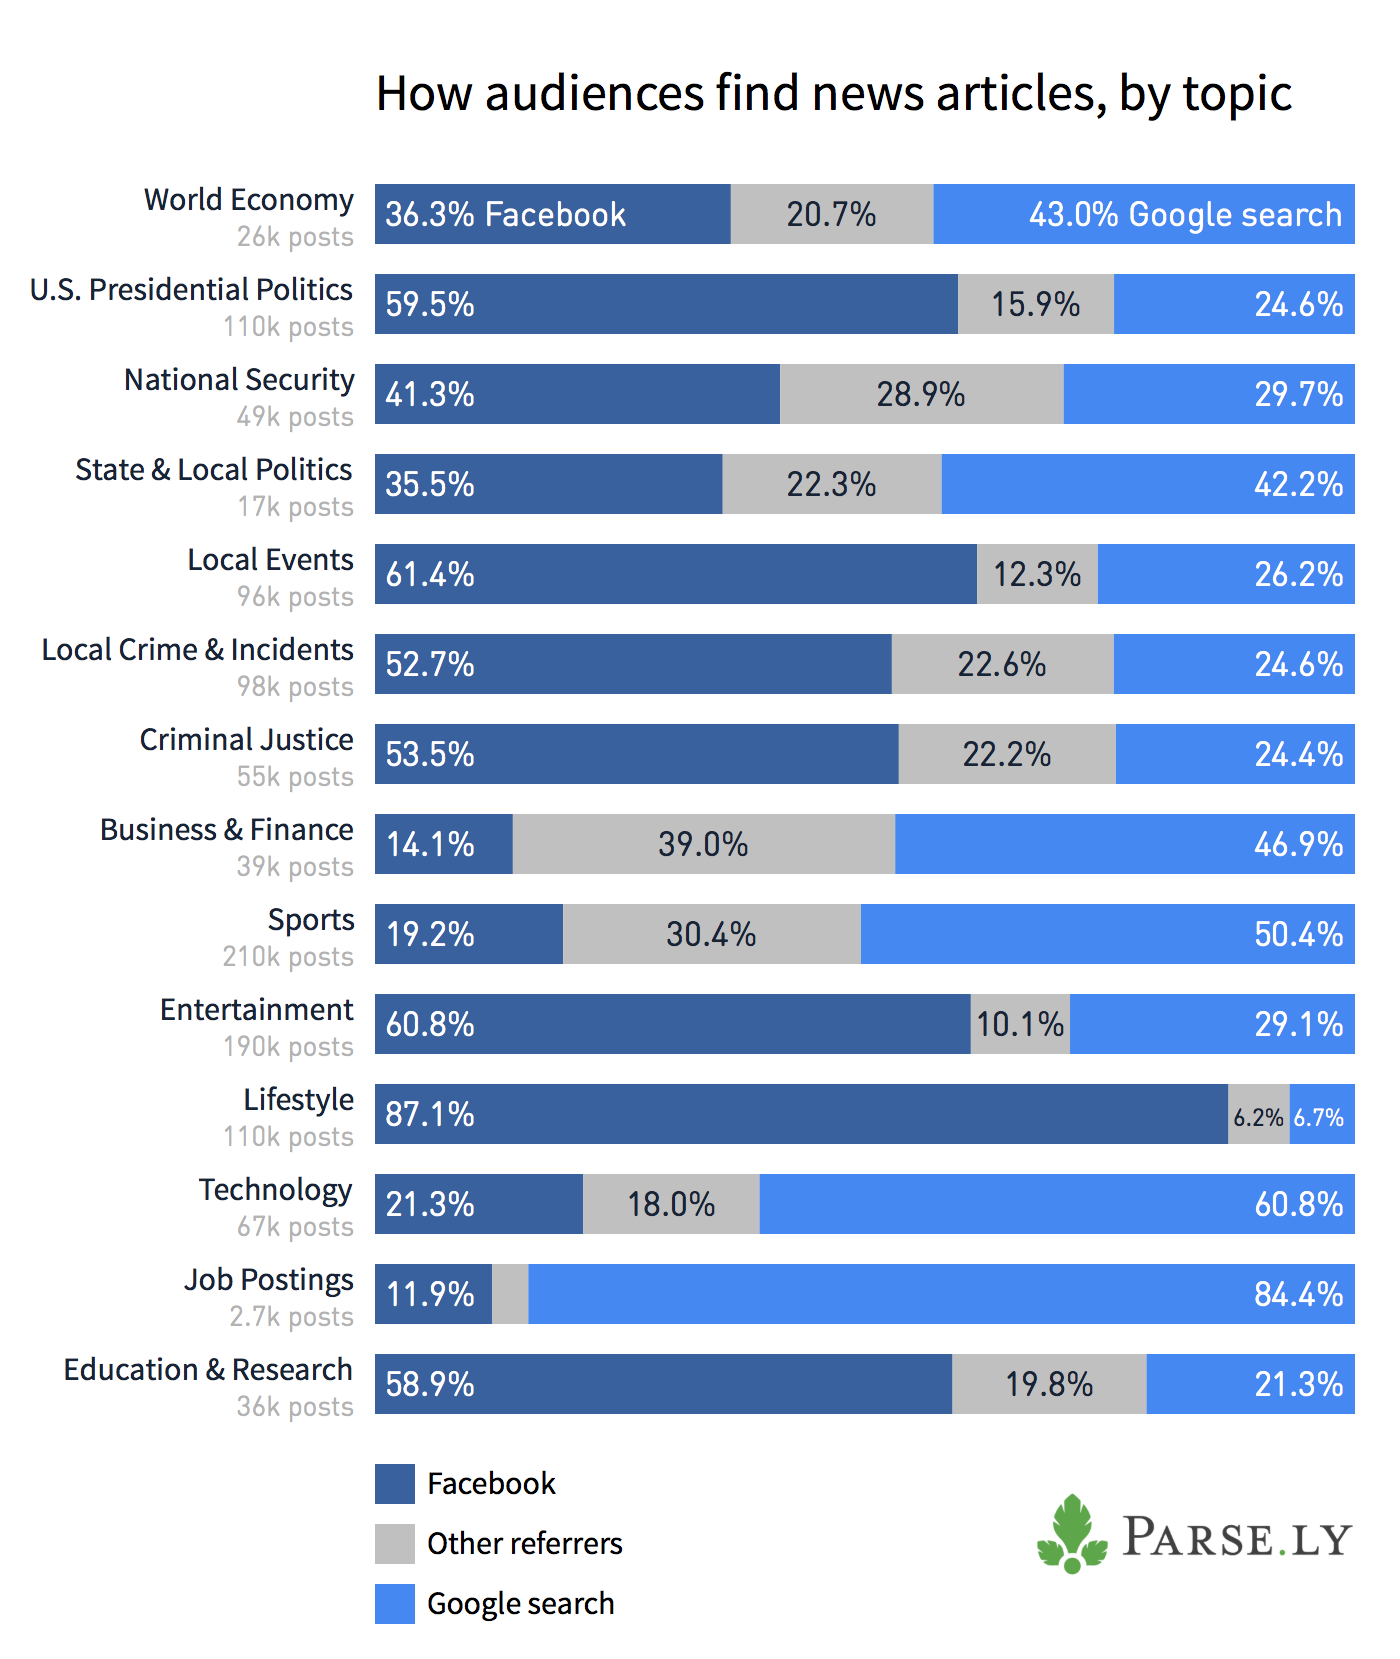
Other topics that see a majority of referrals coming from Facebook include local events (61.4%), entertainment (60.8%), and U.S. presidential politics (59.5%). Topics that draw the majority of referrals from Google search include job postings (84.4%), sports (50.4%), and business and finance (46.9%).
Sports and business and finance stand out because they still draw a significant amount of referrals from “other” sources. Twitter drives over 10% of traffic to sports articles. Google News, Twitter, and LinkedIn are the top three “other” sources driving traffic to business and finance articles. See the full breakdown for each category in the corresponding report.
What else will we be able to discern about audiences based on content topic? With machine learning and AI technology, we’re planning on getting a much better picture of content in 2018, and helping the people that write about those topics use it to find the audience that matters to them.
2018: Monetization options based on data, not hype
Next year, we hope to use these trends in engagement data and referral traffic to connect media companies to the elusive component of monetization.
Measuring engaged time instead of page views could help publishers connect the dots between user experience and premium products or membership models, as Slate is attempting.
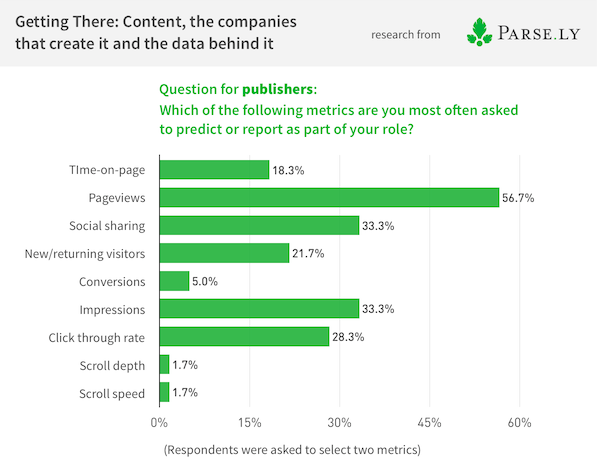
It means transforming organizations from the ground up. While individuals in newsrooms are already thinking about drawing data insights from time-based metrics, not everyone is on the same page. Earlier this year we learned that 50% of publishers think time-on-page is the best indicator of content success, followed by page views.
However, professionals are only asked to report on time-on-page 18% of the time. Most often—57% of the time—they’re asked to report on page views. (See the full study here.) For organizations shifting towards reader support models, the way they understand their audiences through metrics needs to evolve, too.
As media companies continue to experiment with audience engagement, diversifying revenue, and reaching the people that need to see their stories, paying attention to how we pay attention online is more important than ever. One prediction for 2018 you can count on: we’ll be collecting, analyzing, and sharing more findings than ever before. Join us in the conversation!