Time is Money: Why Google Analytics is Costing You
“Google Analytics is free, so we’ll keep using it and get rid of other tools.”
As marketing and media teams evaluate budgets and trim costs, that’s often the first out-the-gate suggestion. In reality, relying solely on Google Analytics (GA) to deliver everything you need to make smarter content decisions may actually be costing you time, money, and business results.
When data is key to proving the value of your content to get leadership buy-in—and therefore, more resources—it’s essential to use a tool that allows everyone on your team to get the data they need to make smart decisions. And one that helps protect your investment in content production and the teams behind it.
Of course, many editorial teams make Google Analytics their go-to tool for measuring story performance. But how many writers on your team are actually looking at the data? The answer is often zero (maybe one or two, if you’re lucky). In fact, most editorial teams have to reach out to a different team entirely, maybe a dedicated data analyst, to pull what they need and format it in a way that makes sense.
Every minute spent trying to figure out how to navigate Google Analytics is time wasted, especially for time- and resource-challenged teams.
It’s no secret Google Analytics is challenging to use. Many writers lack the technical knowledge to use it effectively. No wonder 24% of those who measure their content still don’t have a clear picture of performance, which we learned in our Content Matters 2023 Report.
One size does not fit all
GA has pre-set events it tracks out of the box. If you want to deviate from these (as most organizations do), good luck. A colleague or external agency must create custom events to track additional metrics, conversion events, etc. This invariably requires many resource hours to create, test, and validate them to ensure they fire correctly.
Customization is touted as one of the “biggest benefits” in GA; unfortunately, it’s another terrible time and resources suck. If you skip it altogether, you’ll likely waste time trying to make sense of the data yourself or wait for someone else to gather and maybe interpret it for you. Wouldn’t you rather take the data reins yourself and make faster, easier, informed decisions about your publishing strategy?
GA4 may be a step backward
You may have heard that GA users must migrate to Google Analytics 4 (GA4) by July 2023. Alas, this new tool won’t meet the requirements of many editorial teams. It’s more complex, and the data it spits out is harder to understand.
“We currently use GA, but GA4 doesn’t suit our needs and other platforms may be out of our budget.”
Furthermore, features that publishing teams currently rely on, like “Views” and real-time data, will sunset. Their removal will further hinder teams from self-serving important data and insights.
The more stakeholders who can quickly access content analytics, the more data-driven decisions can be made across your organization.
This is a great investment in your team, especially if they can’t get the content performance insights they need out of GA to do their jobs better. Using a tool that offers self-serve data in a user-friendly way will save not only time but help l drive business success.
“We chose Parse.ly because it’s so user-friendly, especially for an editor who wants to be able to report on how their content is doing right away.”
—Morgan Gibson, Senior Manager of Digital Content, WeddingWire
Often individual team members can’t see the big picture and how their work contributes to the larger organizational strategy. But the more they understand the components of their output and how they generate business results, the better they can adjust and optimize their efforts.
All that is possible with Parse.ly.
Built for editorial teams, Parse.ly equips everyone publishing content with both high-level overviews and low-level granularity about the effectiveness of their content efforts. Creators quickly understand the differences in channels, topics, audience engagement, campaigns, and more, identifying areas to tweak and improve.
If you could take just a few easy steps to increase conversions or ad revenue by 5% or 10%, wouldn’t that make the investment worthwhile?
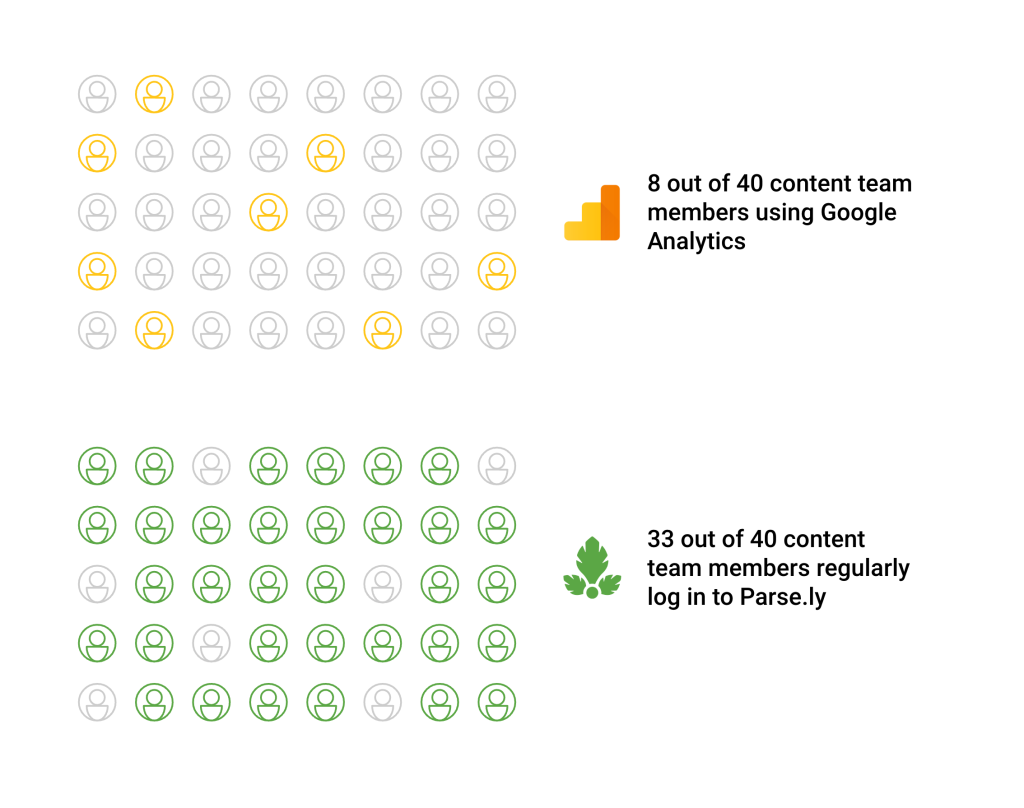
Our customer NAPCO agrees. When they relied on GA, only eight of 40 editors looked at data. Now, after adopting Parse.ly, they have 33 editors reviewing data on a regular basis, helping monetize content.
“Parse.ly is an incredible tool for democratizing data. Its intuitive nature helps the creative teams internalize the data and begin making more data-driven decisions without the need for constant support from an analytics team.”
—Dan Stubbs, VP of Analytics, A+E Networks
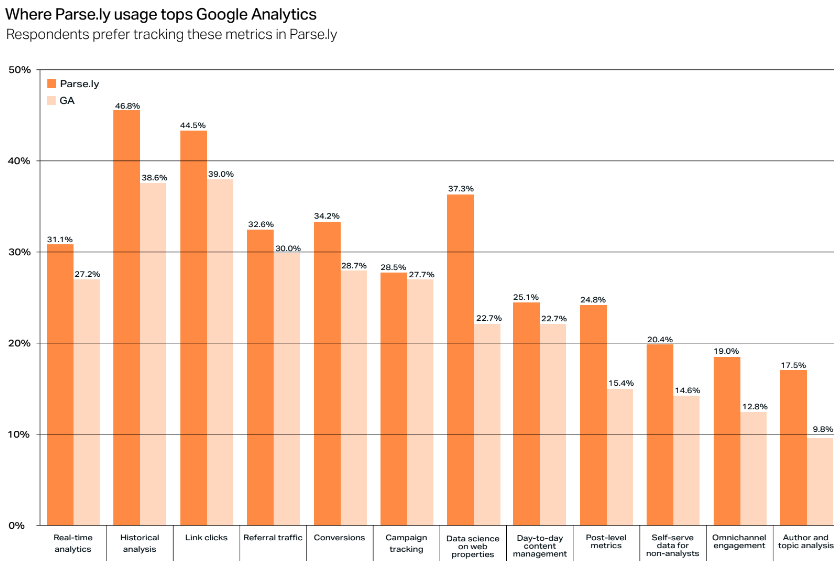
Our customers are proof of just how much easier the Parse.ly platform is to use. Despite Google Analytics being free, they still choose Parse.ly to track:
Real-time analytics
Historical analysis
Link clicks
Referral traffic
Conversions
Campaigns
Web property data science
Day-to-day content management
Post-level metrics
Omnichannel engagement
Author and topic data
Team management made easy
What’s more, Parse.ly is also built for managers, letting them quickly see what is happening across their team. This makes the feedback process simple, quick, and effective, helping managers and team members pull in the same direction.
For example, in the Parse.ly dashboard, managers can view content by date, author, tag, and more. By knowing which authors garner the highest engagement or views and which topics engage audiences best, teams make more confident publishing decisions.
Also in the spirit of self-serve data, you can schedule and auto-email content data reports to teams (or individuals), and set up timely alerts to help spot and boost trending content.
Customer Ben Maxwell, Publishing Director of Network N, uses these time-saving and insight-gathering features to make sure his team writes only about things that matter most to their audience.
“We definitely work more efficiently as a unit because of Parse.ly. Google Analytics is like using divining rods, or interpreting blood from chickens. We needed something more visual.”
—Ben Maxwell
Why Parse.ly is worth the investment
If your analytics tool is hard to use and only understandable by a few, it’s not working for you—you’re working for it. Besides an easy-to-use dashboard, Parse.ly offers intuitive analytics views that show teams the data they need and what that data means, without having to rely on gut instinct.
“Using Parse.ly means we never have to guess how things are going. Parse.ly is the best real-time analytics system that I have ever used.”
—Patrick Sturgeon, Managing Editor, College Wires
Real-time data
Parse.ly’s real-time data illustrates how your stories are performing at any given moment. This means you can immediately course-correct your strategy, rather than waiting for data updates. In GA4, there is almost no live insight into how content is performing right now. It typically takes 24 to 48 hours just to process actions that happen on your site—far too late to capitalize on trending content.
With Parse.ly’s real-time views, you see site and content performance, both immediately and in a historical context, allowing you to connect what’s happening now with past trends. In short, you have the data to make informed decisions about boosting, updating, or syndicating your content.
Conversions and attribution models
One of the challenges of measuring content performance is understanding its impact on conversions. Parse.ly’s Content Conversions, combined with our unique attribution models, make it easy to understand how your content is contributing to conversions. This means that you can make data-driven decisions about where to allocate resources to achieve the highest return on investment.
“We have a hard time tying back our top-line engagement metrics from Google Analytics to the rest of the buyer journey, conversions, and which content is continually bubbling up across touchpoints.”
Unlike many other analytics tools, Parse.ly has multiple attribution model options that adjust where the conversion credit is assigned, depending on which makes the most sense for measuring your goals.
First touch: The first touchpoint a user interacts with (ideal for awareness campaigns)
Last touch: The last touchpoint a user interacts with (ideal for conversion goals)
Last post touched: Variation of last touch (ideal for content pages rather than landing pages)
Linear: Multi-touch attribution, assigning credit equally to all touchpoints (ideal for brand awareness)
When you need to tie content to ROI, this feature is your biggest advocate. The way Parse.ly tracks attribution and conversions is one of the primary reasons our customers choose us over Google Analytics.
“Tracking the activity of leads in Google Analytics, and what series of pages they have viewed/interacted with before converting, seems impossible.”
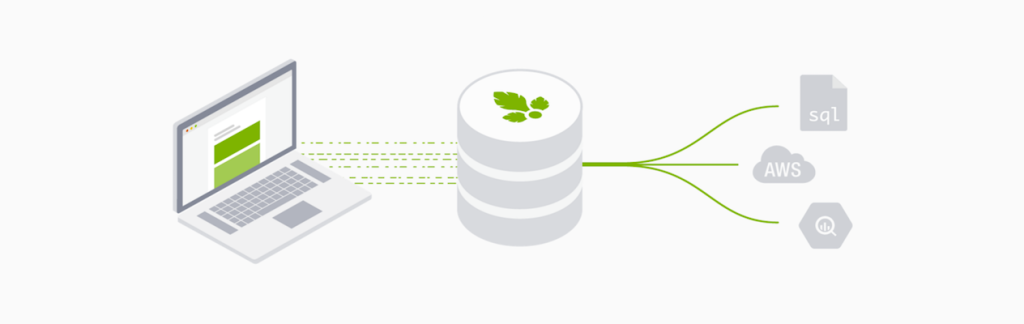
Parse.ly’s Data Pipeline is a swift conduit to building in-house analytics on top of real-time user interaction data. This data is valuable to businesses but usually locked behind a one-size-fits-all analytics dashboard, requiring you to rely on aggregated data exports without the granularity required for actionable insights.
With Parse.ly, you own the data. Our pipeline delivers 100% raw, unsampled data so you can analyze it based on need. Because Parse.ly already runs an analytics service at a massive scale—with more than 50 billion monthly events from 475 million unique visitors—we can deeply discount the pipeline service. Several customers have found this product to represent an order-of-magnitude cost-savings, not to mention a 100% reduction in risks associated with development.
Omnichannel engagement
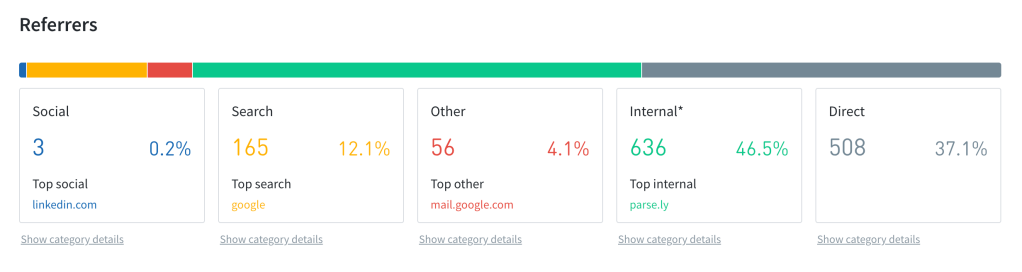
You need to reach audiences on multiple channels—including social media, email, and search. But GA doesn’t show you all those individual channels’ performance metrics in one place. Parse.ly makes it easy to track engagement across all channels, so you can see which channels are most effective at driving referral traffic and conversions. This means you can focus your efforts on channels most likely to result in the highest ROI.
To inform future publishing decisions, you can dive into each channel category to see what posts drive the most search traffic—even filter posts by author, publish date, or word count—all in one dashboard view.
Get more than just data
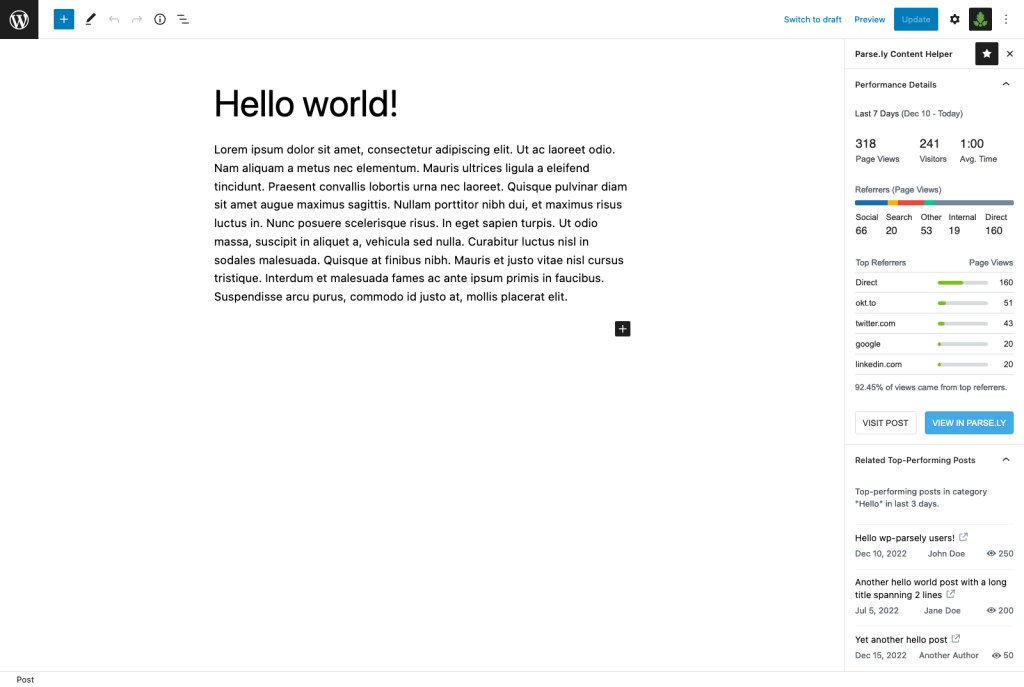
GA offers only after-the-fact insights. Parse.ly goes a step further and helps you build, grow, and optimize a publishing strategy that engages your audience, especially when using the Parse.ly WordPress plugin.
Good resource management means investing in the right tool
Yes, Google Analytics is a free tool. But is it actually costing you money by slowing down your team and not surfacing the insights they need to make data-driven decisions that improve content performance and drive revenue?
We believe it’s better to protect the investment in your team and content by further investing in the right tool to understand the performance of that content and how it helps you reach your business goals.