3 new ways to view your audience engagement data
It shouldn’t take hours of clicking around and consulting documentation to find the audience data you need to make a decision.
We’ve always believed that, and our customers affirm it. Slate’s Director of Research Anna Gilbert recently told us: “Parse.ly gives people what they’re looking for in a way that’s not overwhelming, but it’s still a source for answering complex questions.”
We’re continually iterating on our products to streamline the delivery of the information that matters to you most. Our latest release introduces three new ways to view data in the dashboard, so you can find answers quickly and focus on getting stellar content in front of your audience.
Make your own custom data snapshot
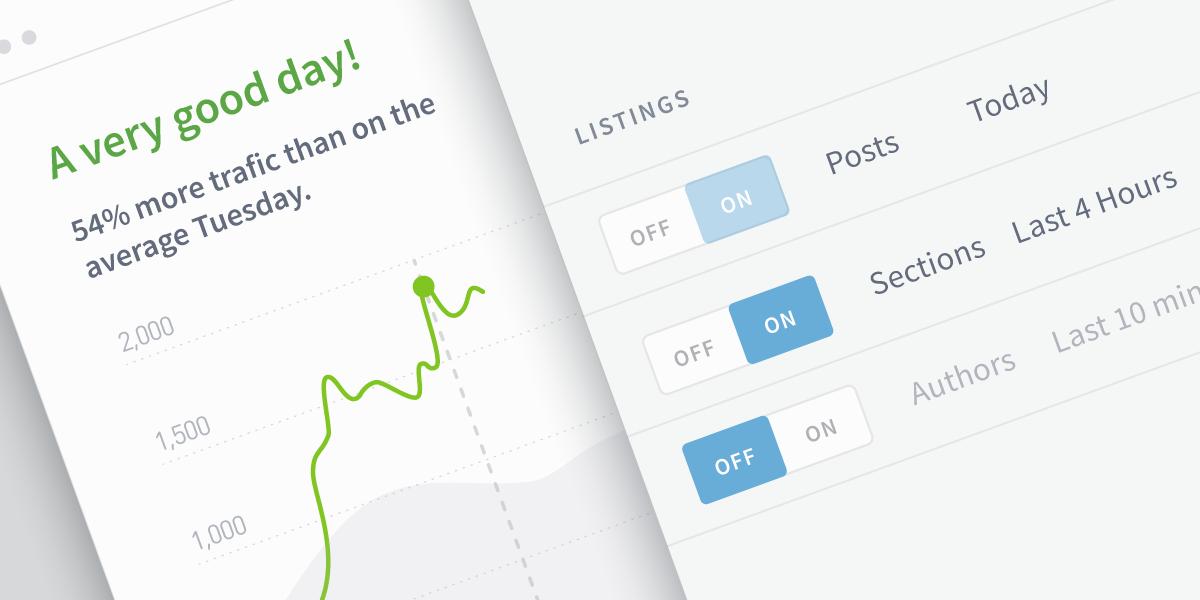
No matter your role, Parse.ly makes it easy to see the results of your work at a glance. You can now change the settings on Overview to only show the numbers from today for a particular author, section, or tag.
Note: the eight-week average isn’t shown on filtered views.
Reporters, filter your Overview to see just the stories you wrote; editors, see only your section. When a particular topic—like a hurricane or the Olympics—attracts attention, filtering by tag can reveal which aspects of those stories have the most traction.
If you often display the full-screen version of Overview on monitors and TVs around the office, you’ll recognize some of the settings on “regular” Overview. Click a cog to change the metadata, time range, and metrics shown in each column.
Customize your Overview now or check out these ideas for setting up Overview by role.
Filter paid traffic and fix campaign errors
You’ve been telling us you want a way to separate paid and non-paid traffic. We heard you.
With campaign groups, you can create a custom filter that excludes paid traffic on any of the listings pages. Once you create a campaign group, everyone who has access to your site’s dashboard will be able to see the group and apply it as a filter.
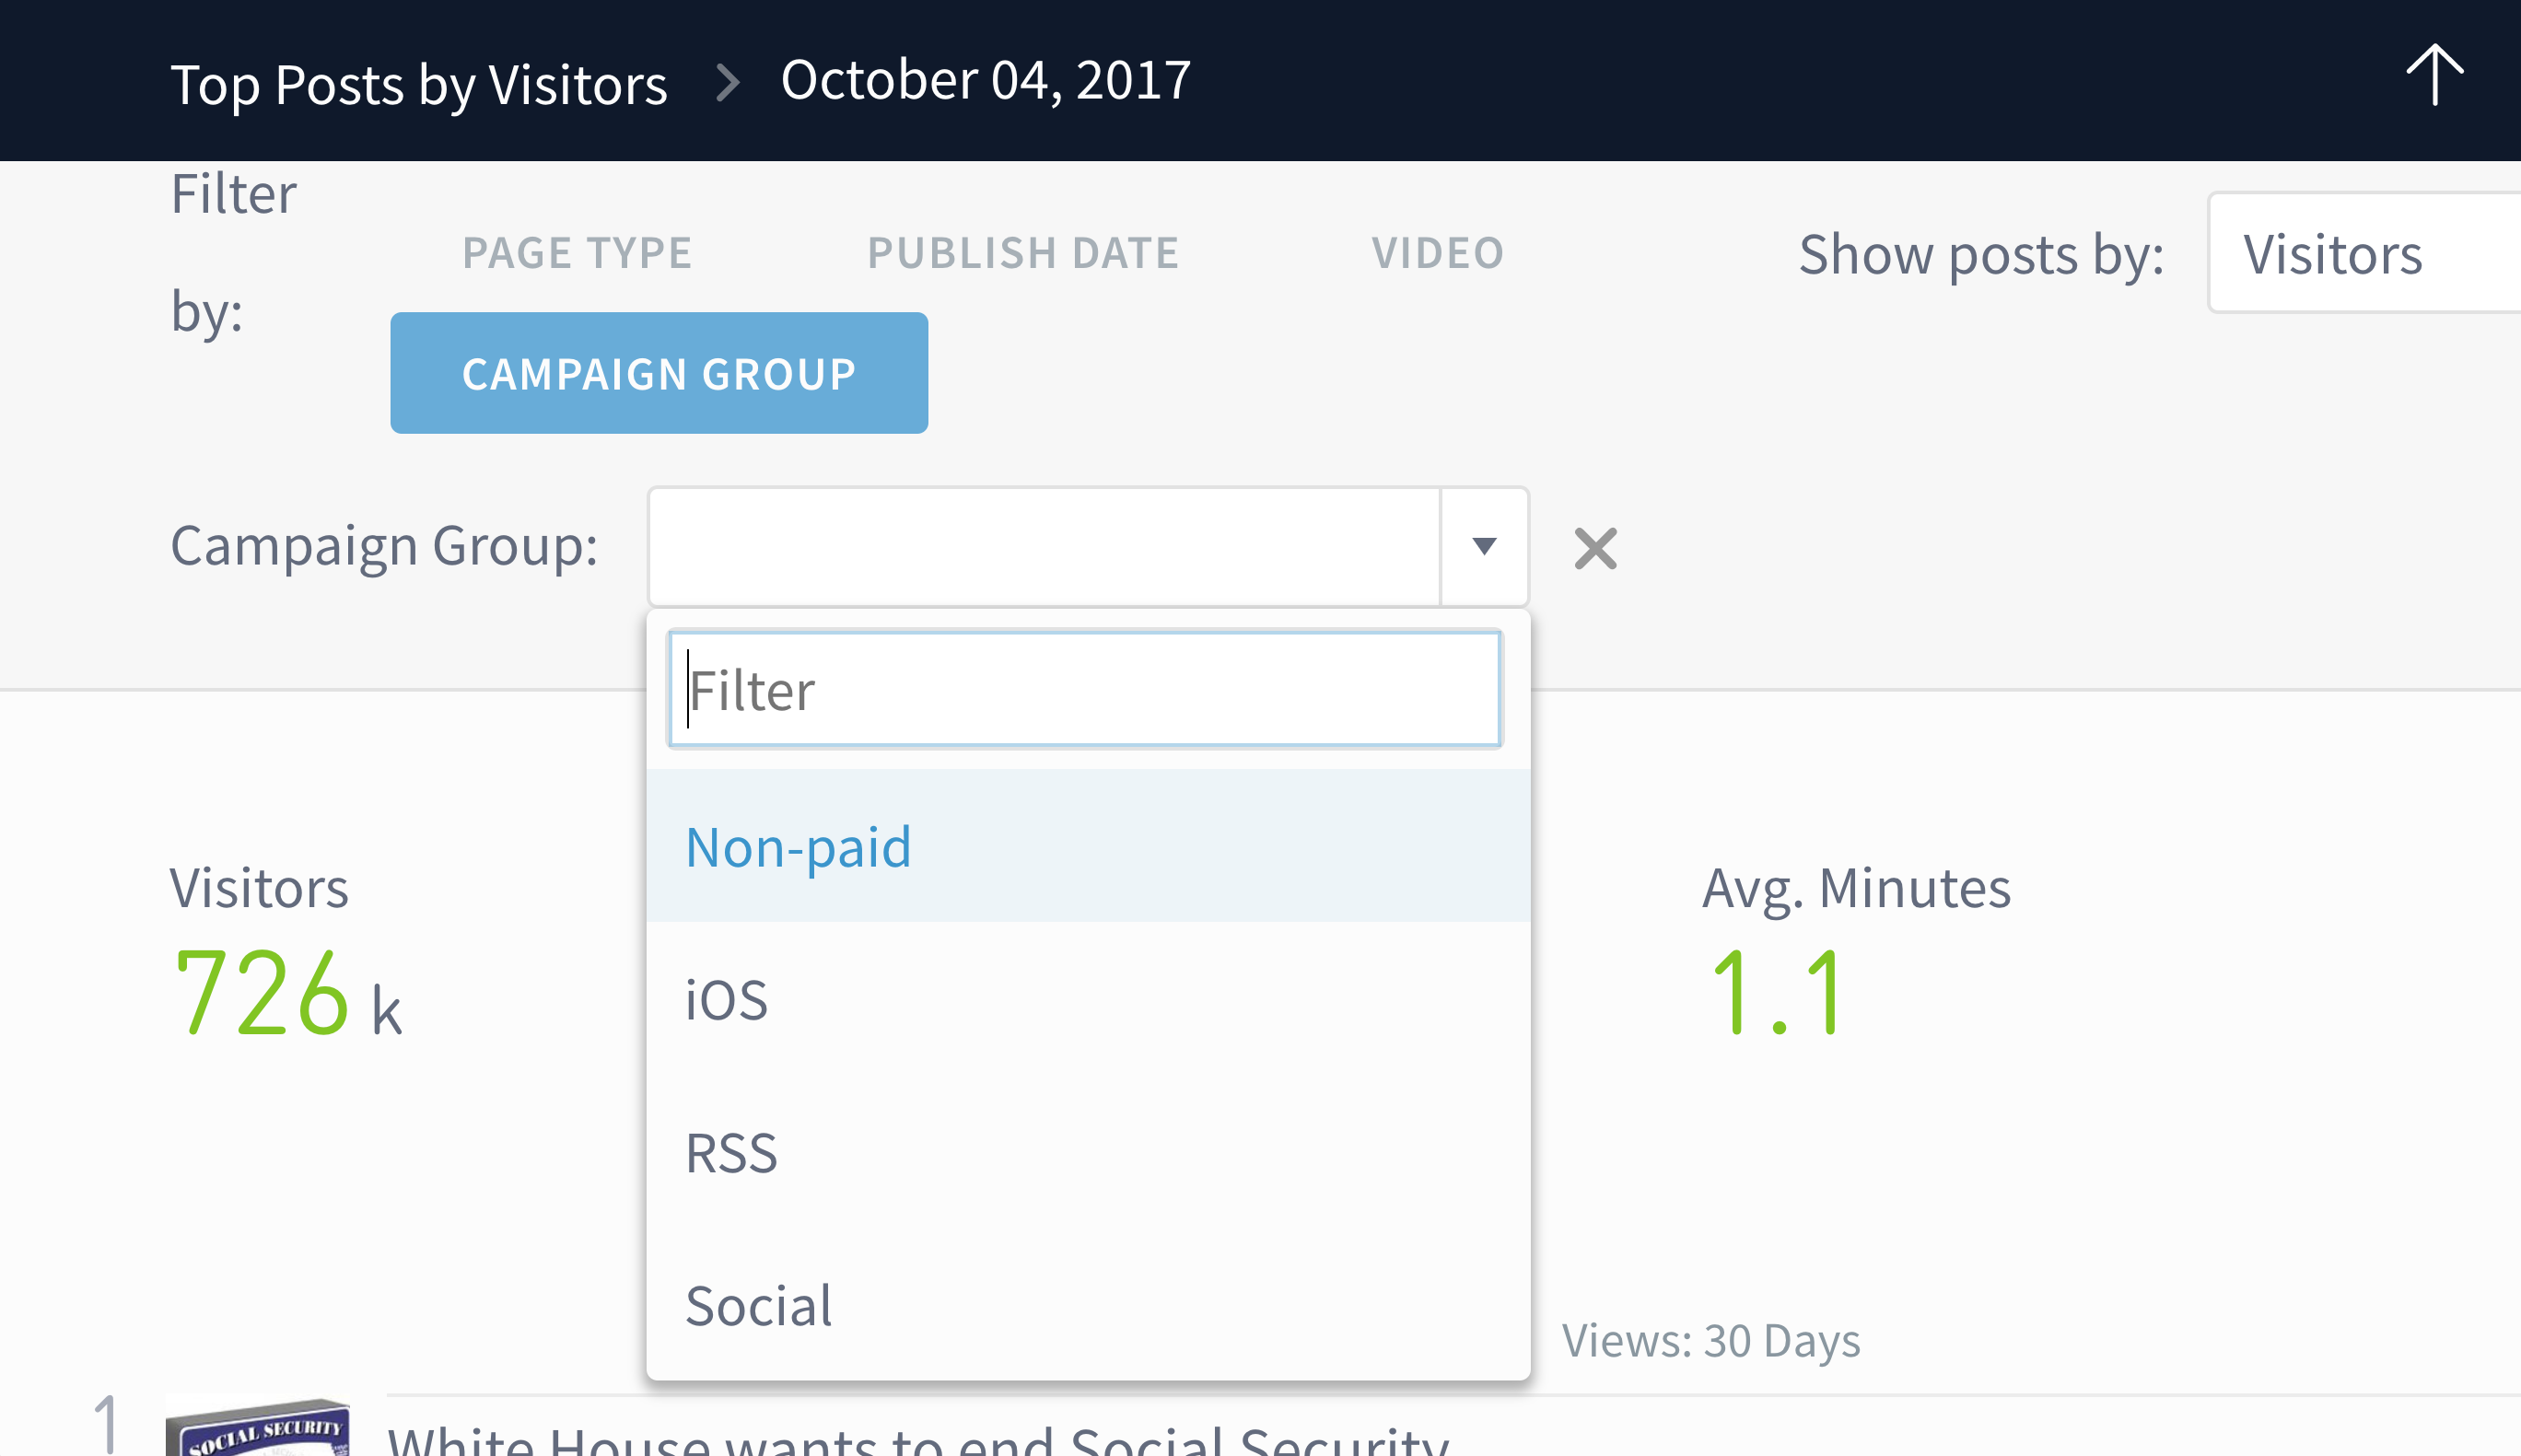
Campaign groups come in handy for audience developers or marketers who’ve ever made a typo when adding a campaign parameter to a URL. Put those misspelled values into a campaign group and… presto! All those versions are consolidated in a single view.
Go to the Custom Groups tab on the Campaigns page and click Create New Campaign Group to get started.
Categorize sites by vertical, region, and more
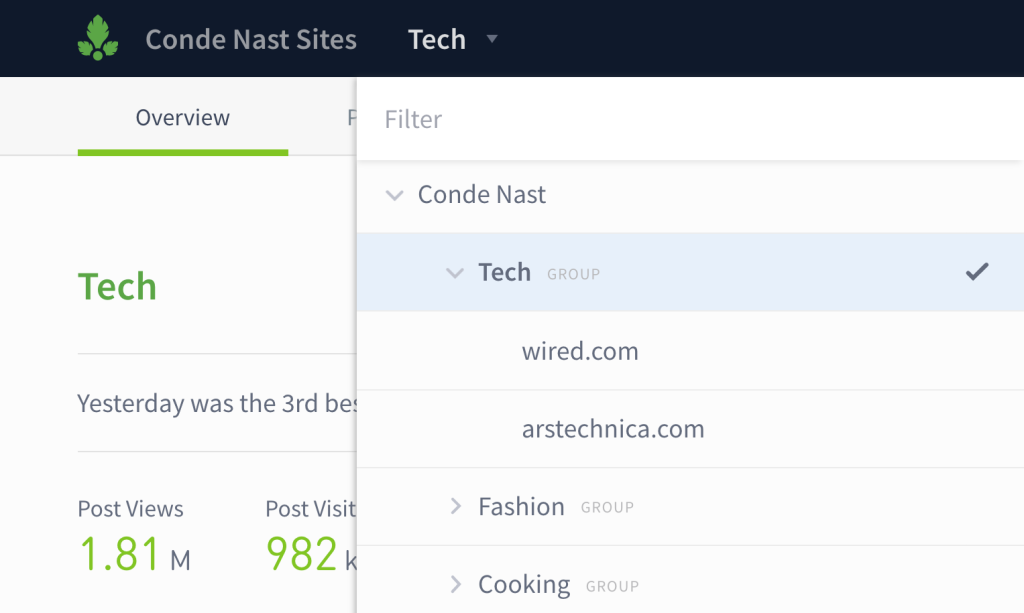
This last one is huge for media giants with multiple websites. Network admins can now make a group of sites and see the data for those sites from a single view. (If you have Network Rollup enabled already, think of this as a “sub-rollup.”)
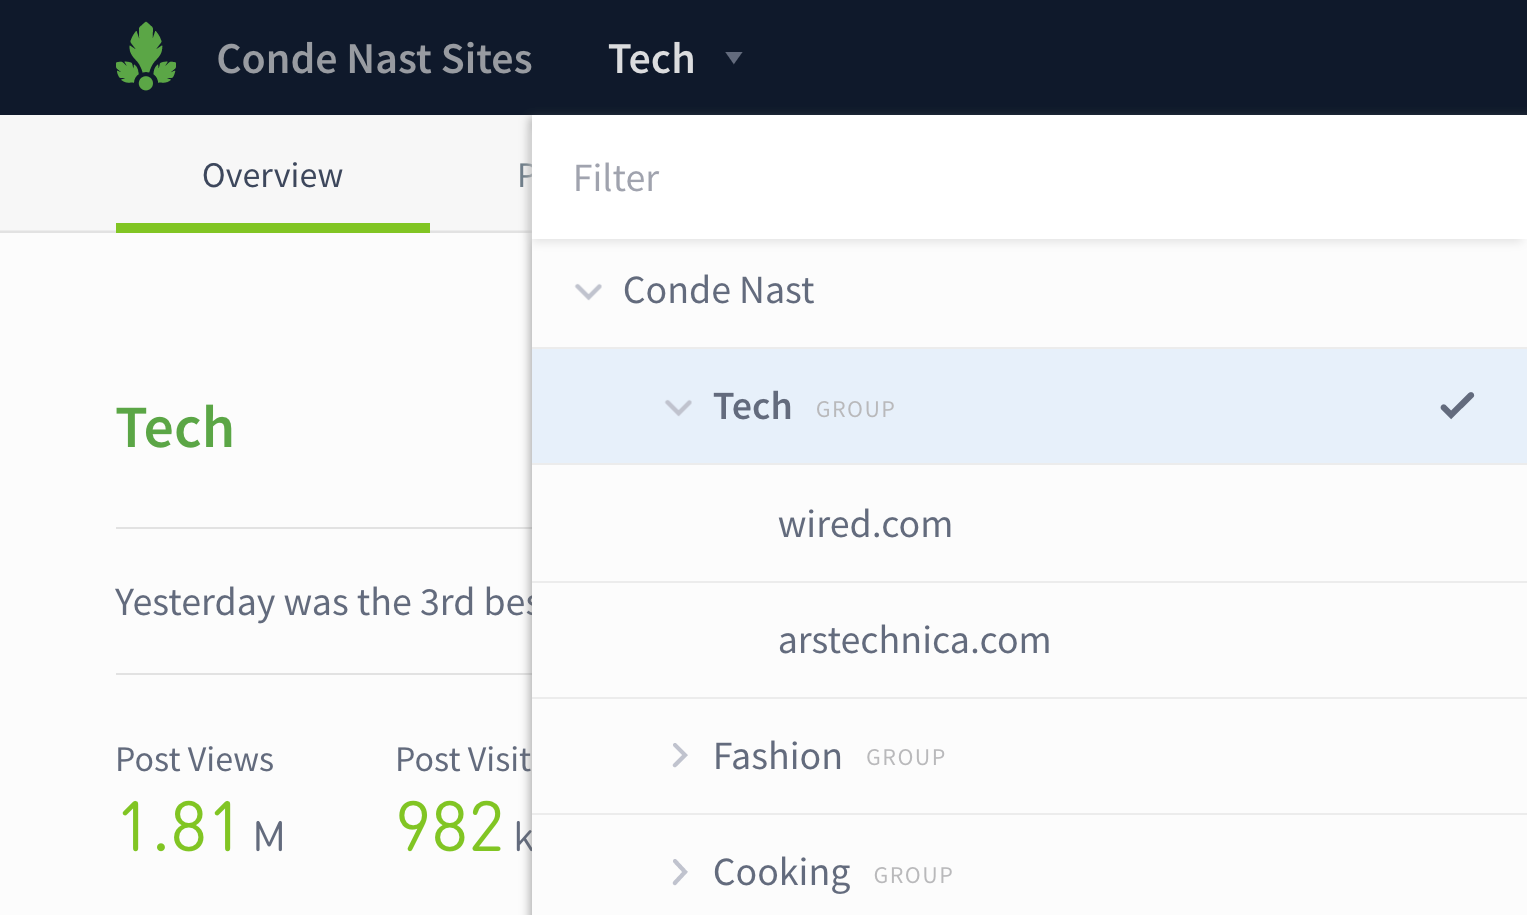
Say you’re a big media company like Conde Nast, with publications that span a variety of verticals. Grouping together technology sites—Wired and Ars Technica—or fashion and beauty sites—Allure, Vogue, Teen Vogue, and GQ—will let you see data for all the sites in one vertical, in one place. Same thing goes for the staff of a publishing network of local news sites who want to see audience engagement by region. Get an idea of what’s successful for one site and apply those insights to other sites that cover similar topics.
When you’re ready to set up a site group for your network, click on Site Groups in the account drop down.
Note: To create site groups, you must be a network admin and your Parse.ly account must have Network Rollup enabled. Check out our help docs or contact your success manager for more details.
Keep the feedback coming
None of these updates would have happened without your feedback, so keep it coming! We always want to hear how we can help make your job easier. Reach out any time to support@parsely.com.