#ONA15Data: A Year in Data from Parse.ly
With more than 400 digital media sites as clients, the Parse.ly team is often asked very specific questions about the best ways to reach an audience. Questions like:
- When’s the best time to distribute my story?
- How can I tell if a story I published did “well?”
- How can I use analytics to take action in developing future content?
In addition to the one-on-one work we do with clients on these topics, we dig into network-wide trends and share the most interesting ones in our quarterly Authority Reports. We process more than 40 billion monthly page views / events, 200 million shares, and 600 million de-duped visitors each month — our data set may be the best resource for understanding news readers at scale.
If you’d like to sign up to receive Parse.ly’s quarterly Authority Report, please click here.
This year at ONA15, one of the biggest conferences in the digital media industry, Parse.ly’s General Manager, John Levitt, shared a summary of these findings. But for anyone that couldn’t make it, we didn’t want you to miss out!
Below you can find a summary of the presentation at ONA and a downloadable version of the full slide deck. You can also visit the ONA website for the full audio.
Trends on Audience Loyalty

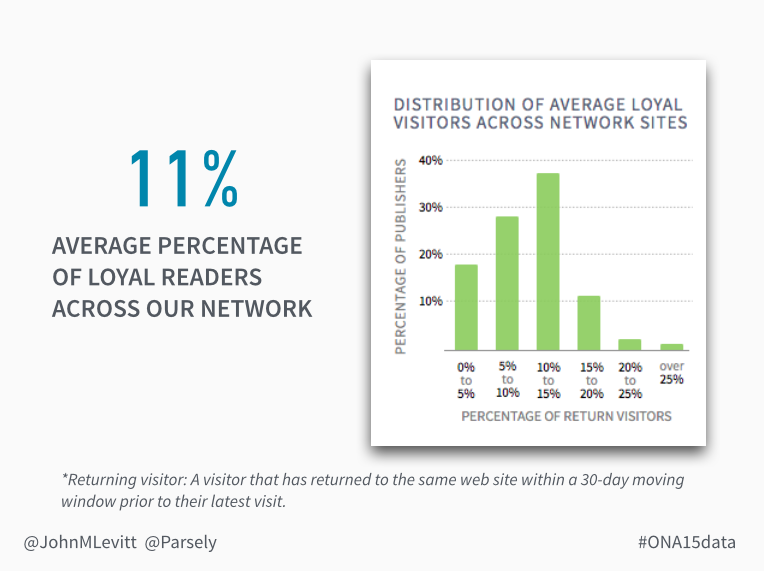
While we don’t have a “favorite metric” at Parse.ly, we know that loyalty is one of the strongest indicators to an online publication that readers trust your brand and the content you deliver. Yet, according to our data, the average site in our network sees only 11 percent of its visitors returning at least once in a 30-day period.
There is huge room for growth here — especially since loyal engagement can be a source of potential revenue outside of advertising, which is important as the ad-blocking conversation continues. Loyal engagement means more opportunities for publishers to experiment with sponsored content, membership models, and subscription models.

Trends on Digital Deadlines

Deadlines! We love to hate them. Since sending articles to print is no longer the issue that it once was, digital publishers have had to rethink the idea of a deadline: When is the best time to publish an article online? You’d be surprised to know that the answer varies.
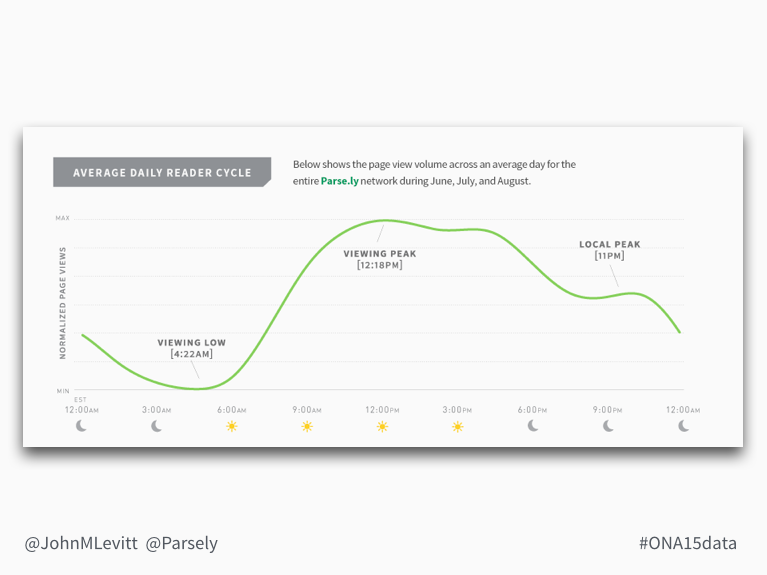
Parse.ly learned that pageviews in our network are lowest at around 4:22 a.m. (not a great time to post an article); they peak at 12:18 p.m. and then again at 11:00 p.m. (better times to post articles). But interestingly, almost all posts are published in the morning.
Although the data doesn’t apply to every site in the same way, it is important for digital publishers to look at trends in pageviews — and other metrics — to figure out when they should post to optimize distribution.

Trends on the Lifespan of an Article

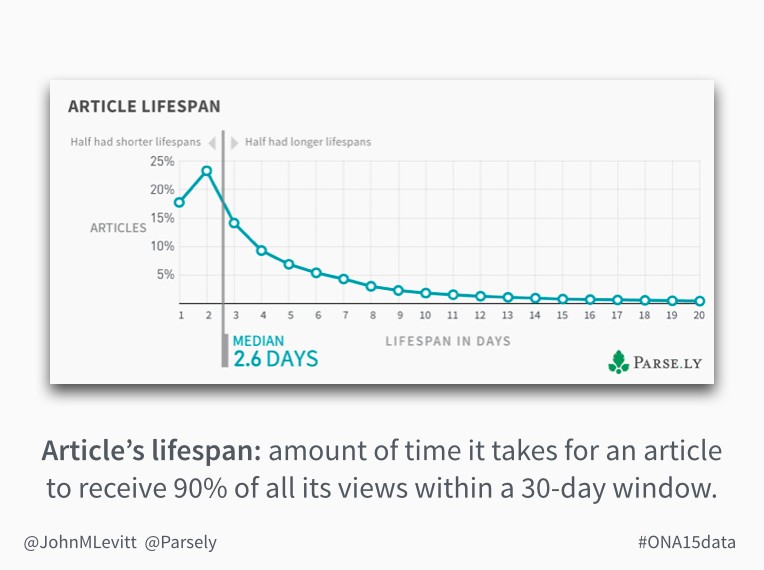
The 24-hour news cycle means that one post barely makes its way through the CMS before it’s time to publish the next one. So what does this mean for how long an article “lasts” online?
The median we found for all articles on our network was 2.6 days — although this was highly dependent on publication type. For example, sites covering breaking news have a shorter article lifespan (of one or two days) and lifestyle sites have fewer articles that remain relevant for much longer.
Can digital publishers increase the lifespan of their posts? Parse.ly learned that articles with Facebook as their top referral source had a longer median lifespan than other sources — increasing from 2.6 days to 3.2 days.

Trends on the Use (and Potential) of Metadata Tags

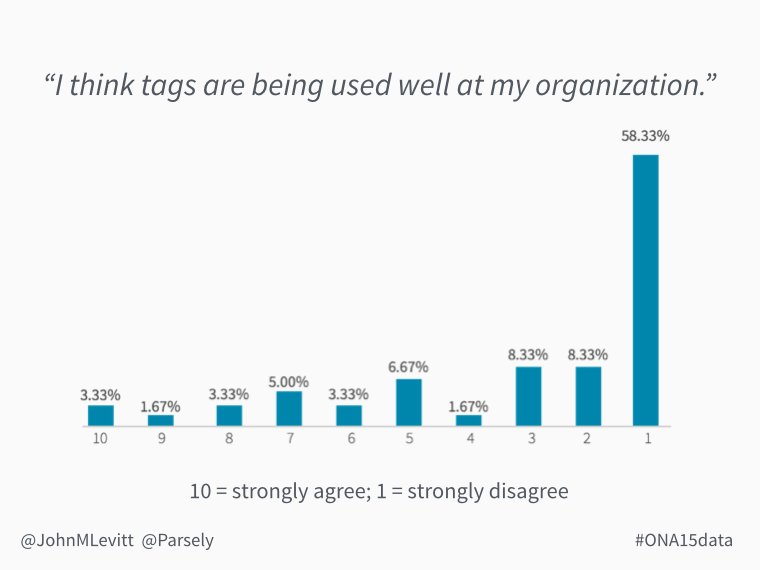
Publishers are not using metadata and tags to their full potential. Thirty percent of Parse.ly’s clients aren’t even using tags, and 37 percent of the articles that our clients (who do use tags) publish don’t include tags. Though the overall use of tags doesn’t seem to correlate with any typical site goals — like increased reach, engagement, or loyalty among readers — we do think tags are being underutilized.
The typical publisher uses 450 tags per month; the average number of tags per post is 5.2. More than 50 percent of all tags are only used once! However, Parse.ly has several clients using tags in interesting ways that are moving the needle:
- Globe & Mail, and others, use tags as part of their paywall strategy
- Business Insider uses tags for sponsored posts
- Fox News tags video content to easily create “trending video” modules
- Telegraph does semantic tagging, and is using its massive archive to help launch a “culture channel” which will serve as a different vie​w into its archives
Trends that Look Forward to 2016
Some of the trends from the past year are helping us predict what to expect in 2016. The biggest guesses we’re taking?
- Publishers will be looking for new ways to monetize that encourage loyal readership, like improving and personalizing site experiences
- With content being increasingly consumed on mobile, publishers will have to work hard to post articles when (and where) readers are looking to consume them
- Attention spans are getting shorter (2.5 days vs. daily or monthly print publications), so publishers need to use data to make sure they are publishing content that resonates with readers
Download the full deck here to see the additional charts and data that was shared during the presentation, or share it with members of your team that couldn’t make the event!
Click here to download the full presentation from Parse.ly
Want to be a part of our data? Even if you’re not on our network, join the conversation by answering Parse.ly’s short survey on some of the most prominent trends in digital media in 2015, and let us know what you think 2016 will bring.