Facebook Continues to Beat Google in Sending Traffic to Top Publishers

Parse.ly’s latest Authority Report revealed that social media, not search, brought more readers to the top news stories of 2015. This trend extended beyond the most-read stories: our quarterly review of the top sources of referral traffic to our publisher network showed that a full 45 percent of referral traffic came from social media sources.
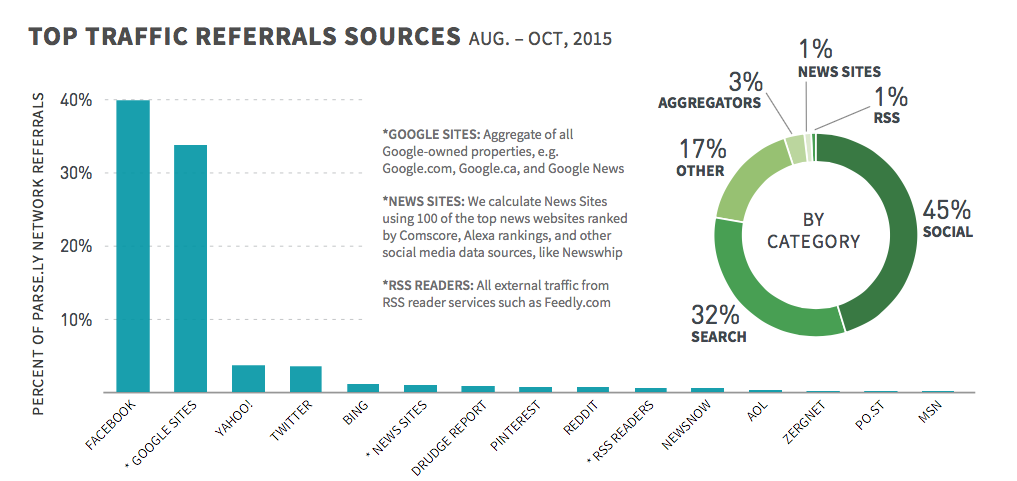
This is an increase from 43 percent in our last report, while search dropped from 38 percent to 32 percent of total referrers.
Much of these changes can be attributed to the two leaders of the respective categories: Facebook and Google. In July 2015, Facebook pulled ahead of Google as the top source of referral traffic to Parse.ly’s network of nearly 400 digital publishers. Today, Facebook remains a top referring site to the publishers in Parse.ly’s network, claiming 39 percent of referral traffic versus Google’s share of 34 percent.
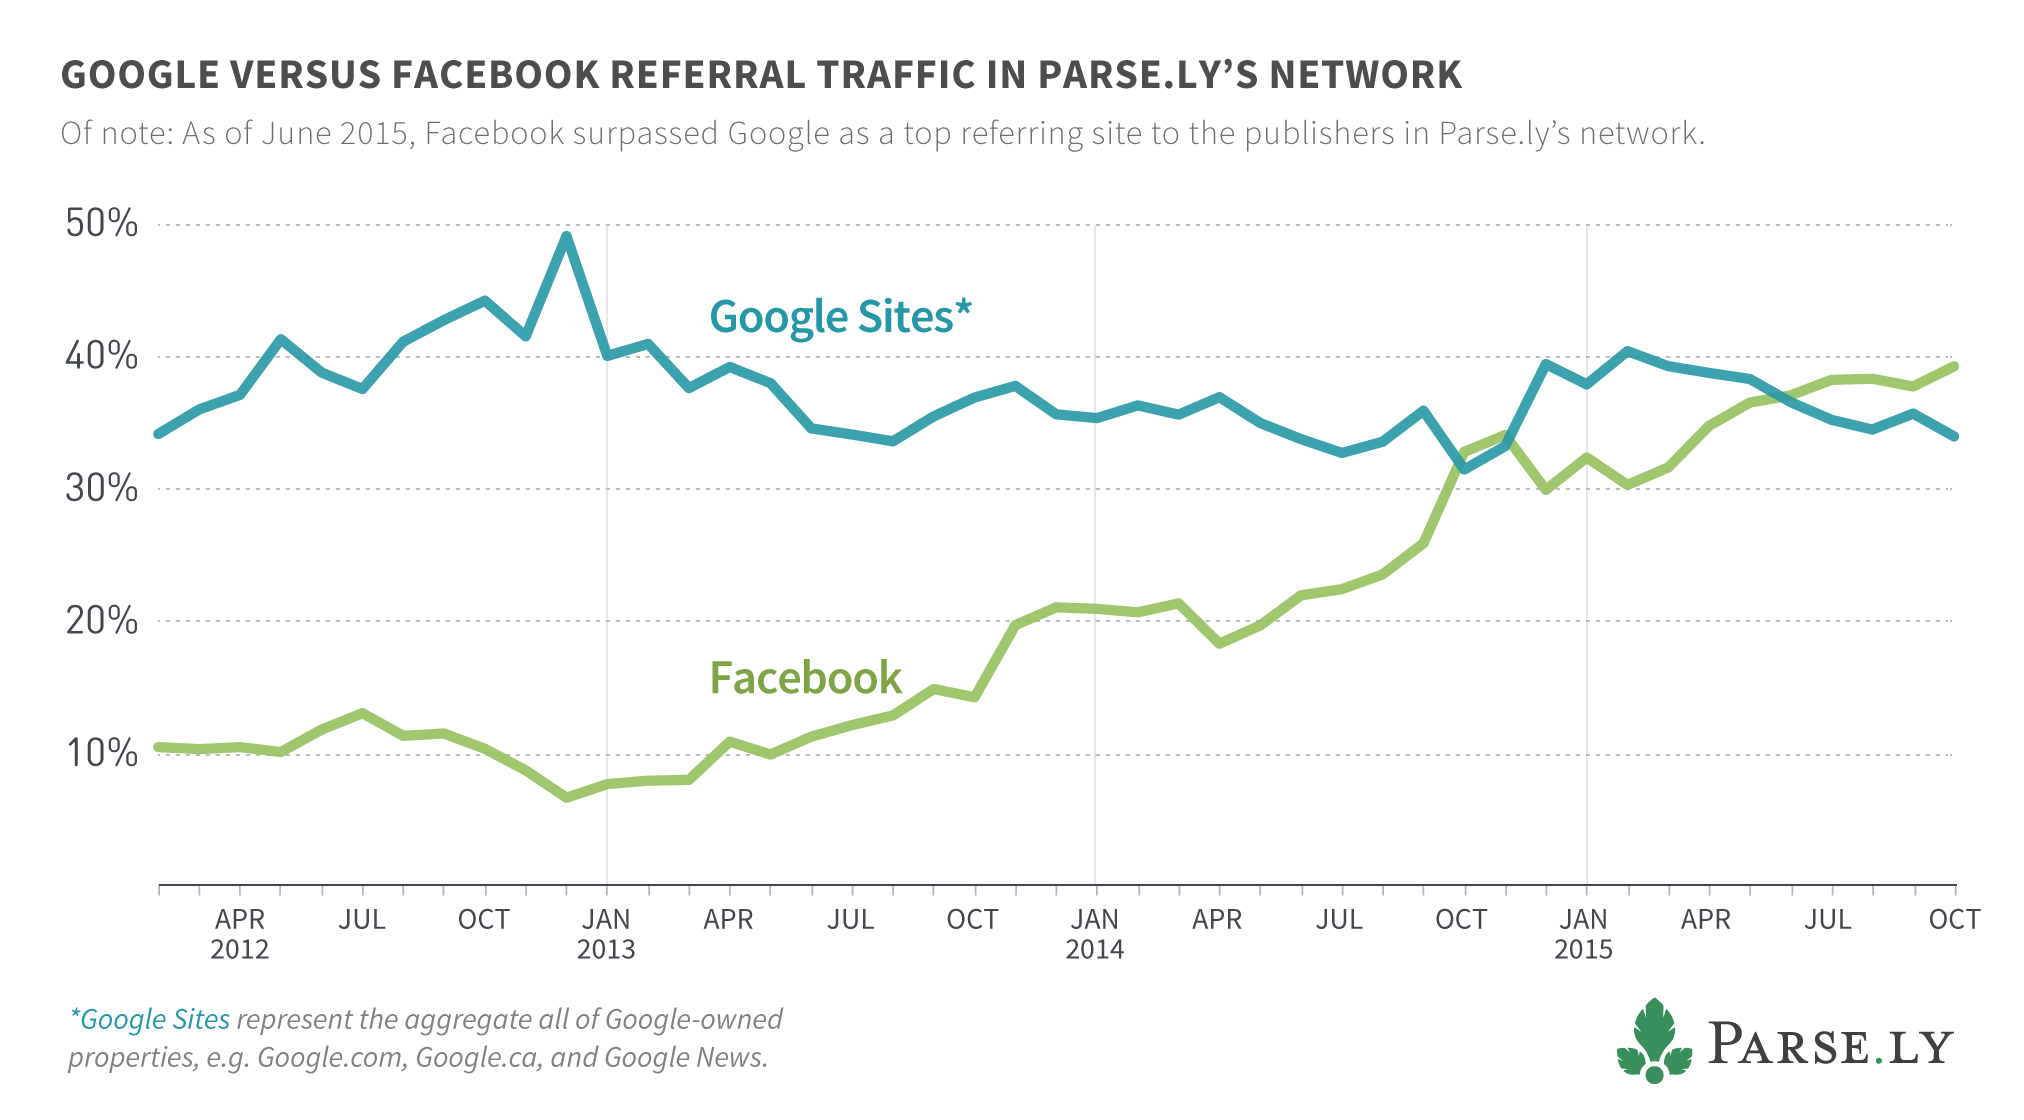
Though this year does show Google on a decline, especially when exclusively compared to Facebook, it’s important to note that as a percentage of overall traffic, Google’s share has maintained fairly consistent since we started reporting on these numbers. This would suggest that the gains that Facebook has made come from the loss of referral traffic from sources other than Google.
This would appear to be in line with Mathew Ingram’s perspective on the “death of the hyperlink,” in which he argues that features like Facebook’s Instant Articles and Twitter’s Moments are just the continuation of an ongoing process of devaluing the hyperlink—a process that values the stream over the URL, the in-app experience over the click.
Another note on this graph is that it does not (yet) include analytics for any purely distributed readership that is coming from new programs like Facebook’s Instant Articles.
Mixed Messages: Evaluating the Parse.ly Data Set
Since Parse.ly shared our most recent data on referral traffic, Digiday, Wall Street Journal, Forbes, and other sources have published information suggesting that Facebook’s traffic to top publishers fell 32 percent since January. Clearly, these two trends can’t both be right: is social traffic dominating as a referrer, or isn’t it?
To answer the question, it’s worth examining the data sets provided in each case. The data provided to make the case for a decline in social traffic to publishers was provided by SimpleReach and SimilarWeb. Here’s what to consider when looking at each report:
Sample Size
Facebook shares heavily depend on the types of posts published. For example, despite our aggregate trends above, we have clients who have other referral sources that far exceed their Facebook traffic. It’s difficult to pull aggregate trends using a limited dataset without obtaining misleading information. In the study quoted in the articles, for example, SimpleReach only looked at data from 30 publishers, which is a very small sample size. SimilarWeb stated it looked at traffic from 50 publishers. The Parse.ly data set used for this study included around 400 publisher domains.
Desktop vs. Mobile
Facebook’s growth has been driven in a huge part by its mobile app — it’s one of the reasons the idea of dark social scared so many publishers (don’t worry, they fixed that!) In the SimilarWeb sample, the data only included estimated desktop traffic from 50 publishers. With many publishers seeing up to or more than 50 percent of readers coming from mobile, this ignores a large portion of the audience.
First-Party vs. Third-Party Data
Another way that the data sets can differ is in first-party or third-party data sources. In Parse.ly’s case, we have first-party data from our publishers because our tracking code is directly on publisher websites — giving us access to analyze network-wide trends for more than five billion page views per month and one billion unique visitors.
This differs from SimilarWeb, which uses panel data: it tracks the user actions of the “tens of millions of users who have installed our apps,” i.e. people that have agreed to have SilmilarWeb track them as they move across the internet.
There are benefits and drawbacks to both types of data sets, depending on what you are looking to analyze; but typically, first-party data will be more accurate. So, we can be confident when we say that Parse.ly has one of the best (if not the best) digital publishing data sets available. But, industry-wide trends aside, one of the reasons that our clients love the data that we provide is that a network-wide trend does not apply to every site, nor to every post.
The most important recommendation we can give to anyone working in digital media is to not make assumptions about your audience, but to make sure you have the actual data — from your own site — on where they come from. This will help you to figure out what content is resonating with readers, and why, and then use this information to gain wider distribution, attract loyal readers, and increase engagement (to name a few potential goals).
See the latest data
The dynamics between Facebook, Google, and other sources of traffic change quickly. Check out the latest numbers by bookmarking our Referrer Dashboard, updated daily.