The data behind the stories of Trump’s presidency

Are people really paying attention?
So far during Donald Trump’s presidency, readers are spending more time with political news, per story, than any other topic. But which of the many storylines coming out of the White House do people care about most?
Axios worked with Google data to map out search trends to see how much curiosity exists, and how long it lasts, for each major Trump-based storyline. Stef Knight wrote of their findings: “The study shows that while Trump’s presidency has been action-packed, the public’s attention span doesn’t seem to last for long.”
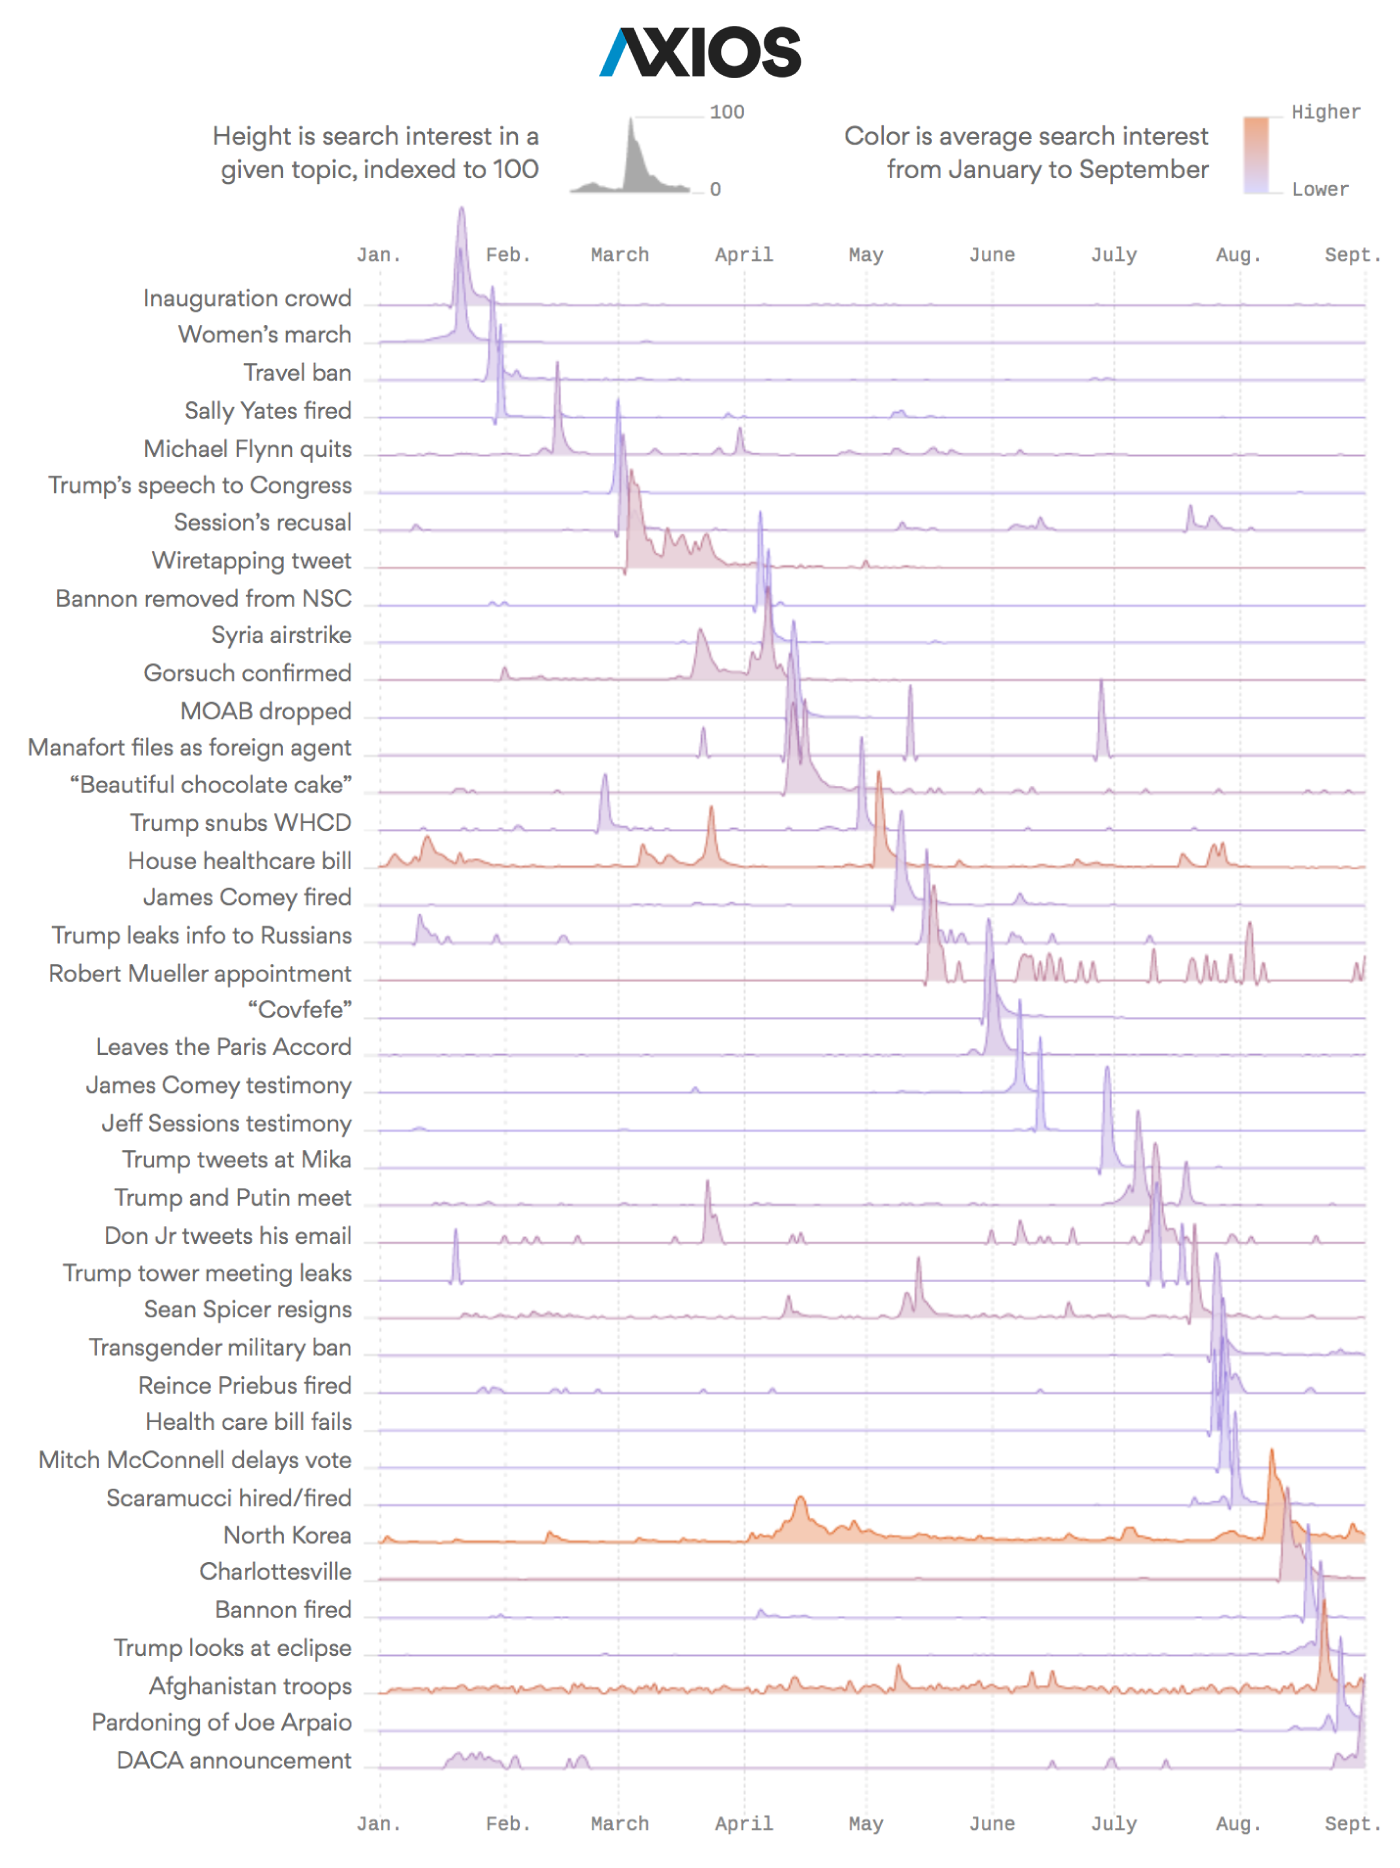
The three most searched for terms on that chart, according to Axios:
- “Searches related to the ‘Women’s March’ the day of the march, January 21.
- Searches related to the ‘Women’s March’ the day after the march.
- Searches related to ‘covfefe.’”
What happens after the search though? Some people find exactly what they need without ever clicking away from the results page, or learn their answer through general information sources, like Wikipedia (or, in the case of “covfefe,” Urban Dictionary).
Many people go on to read articles though. We looked into how readers’ attention to article topics as a whole relates to the search topics examined by Axios.
Mapping search intent to online readership
Search intent shows one way of tracking interest; it gives us insight into what people want to know. However, that requires a very specific intent. When it comes to articles, people find stories just as often through Facebook as they do through Google; they read stories while already on a website or after a friend emails or texts them. These sources would be considered less “intentional,” but have no less effect on the topics we pay attention to.
Given these factors, how closely do search intent and our online attention correlate?
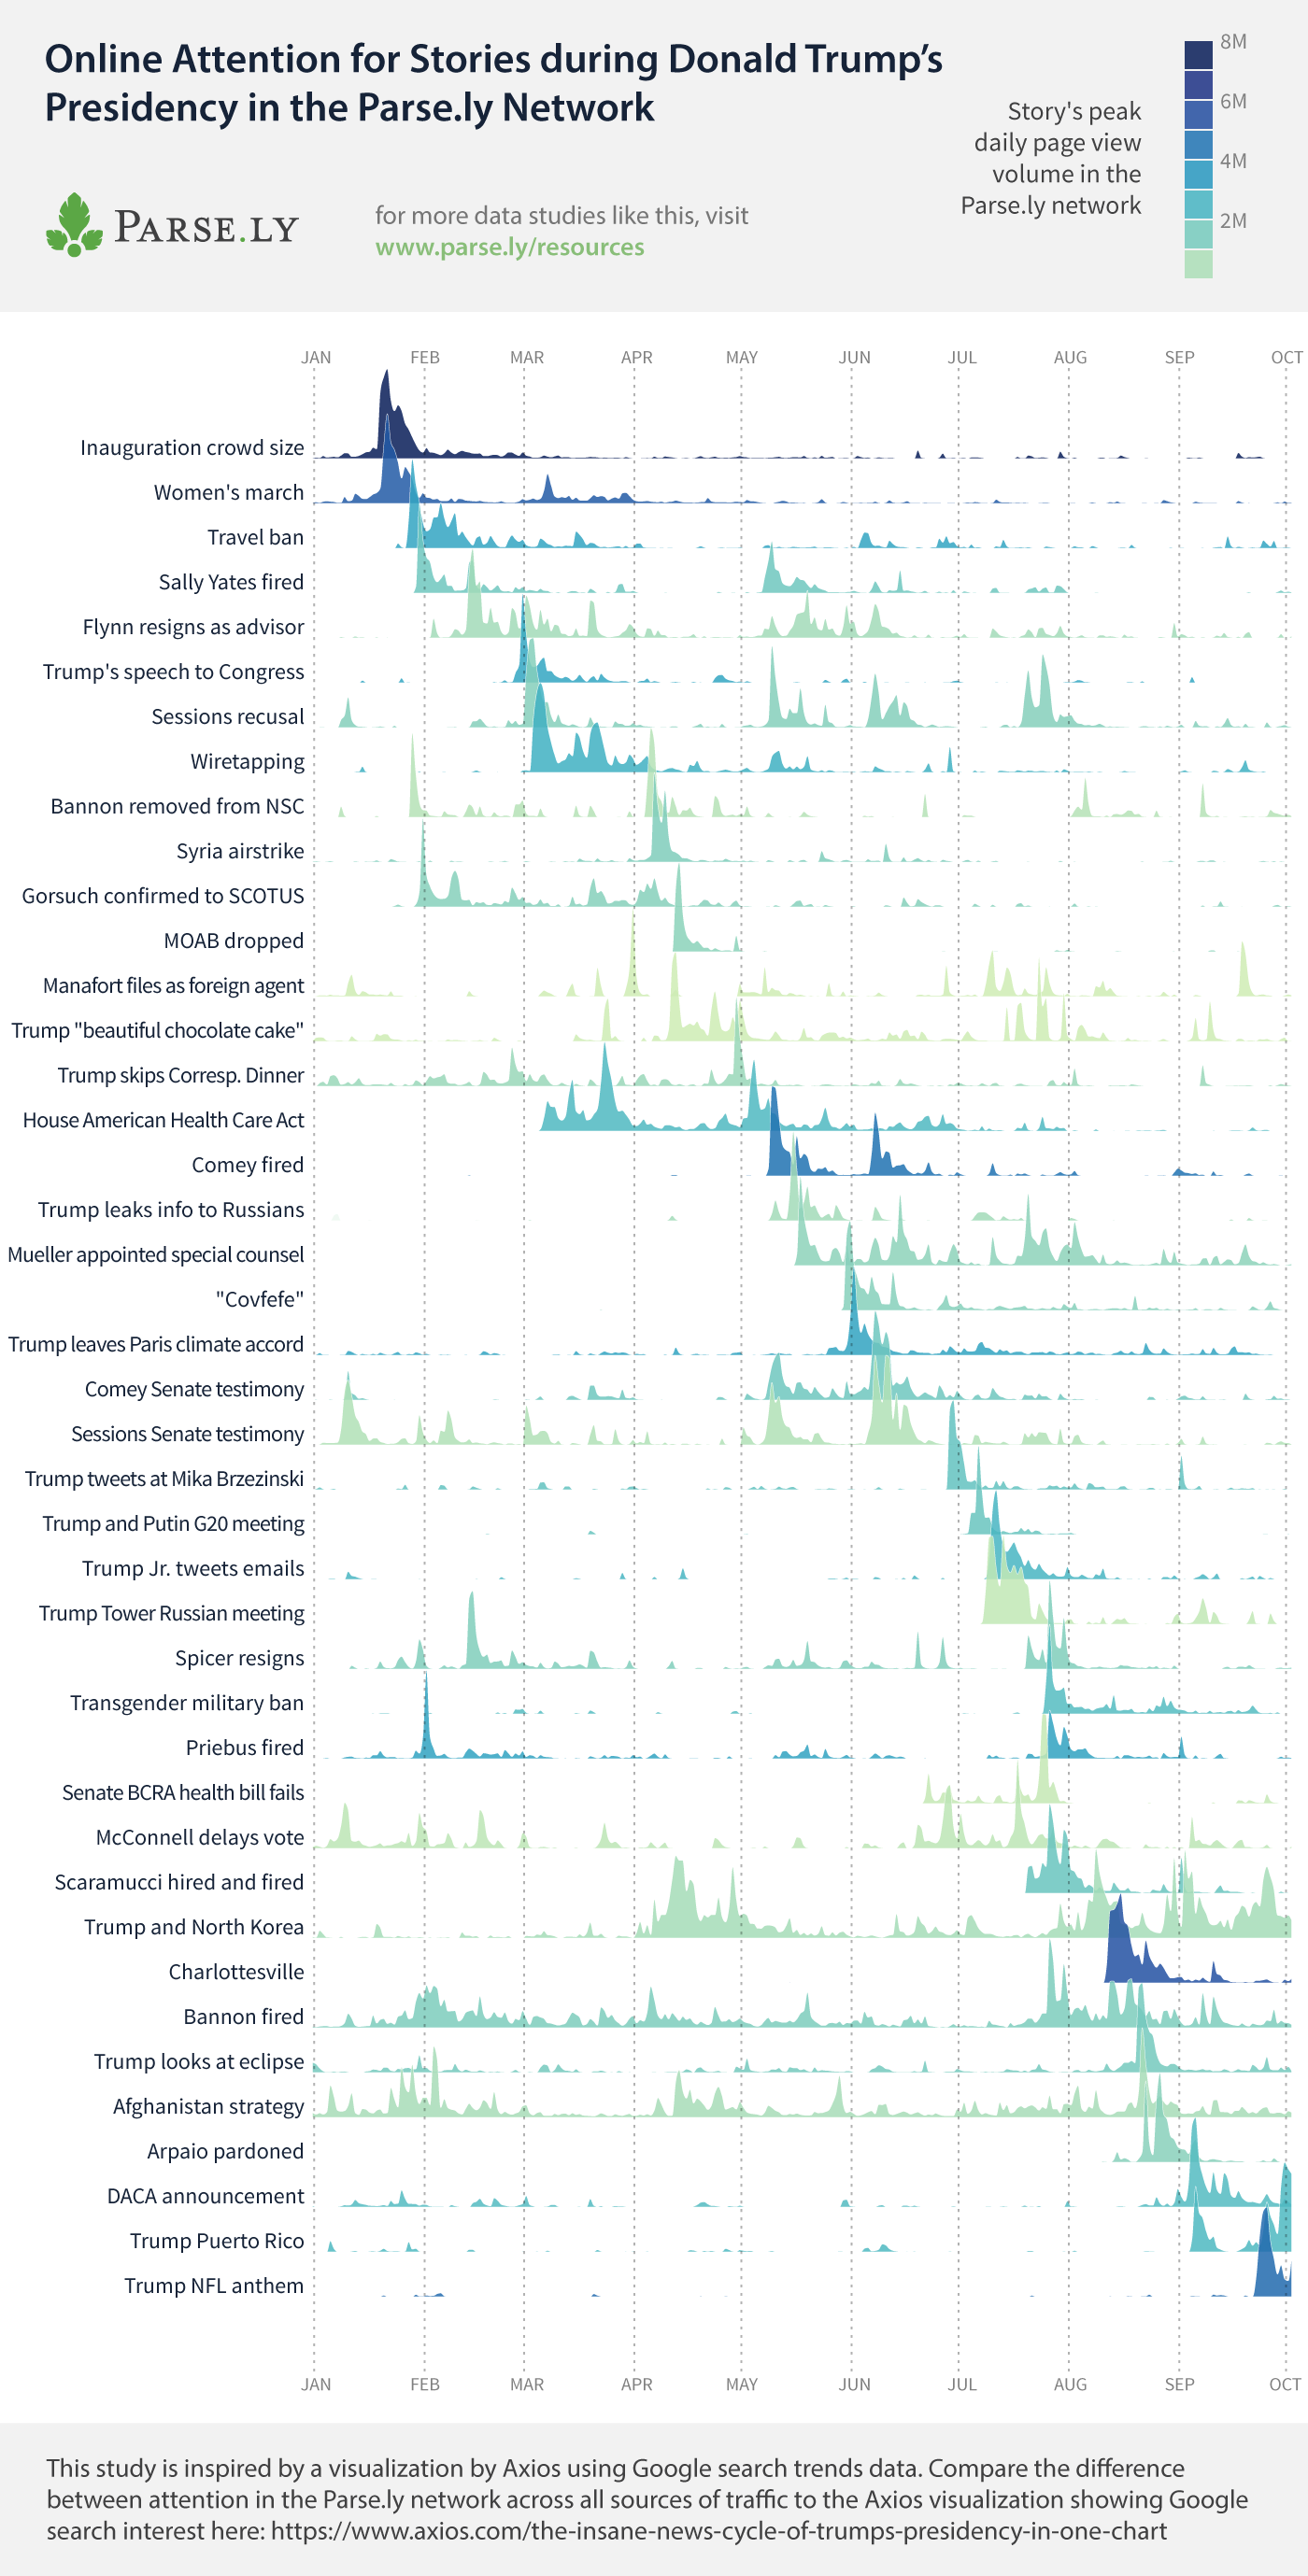
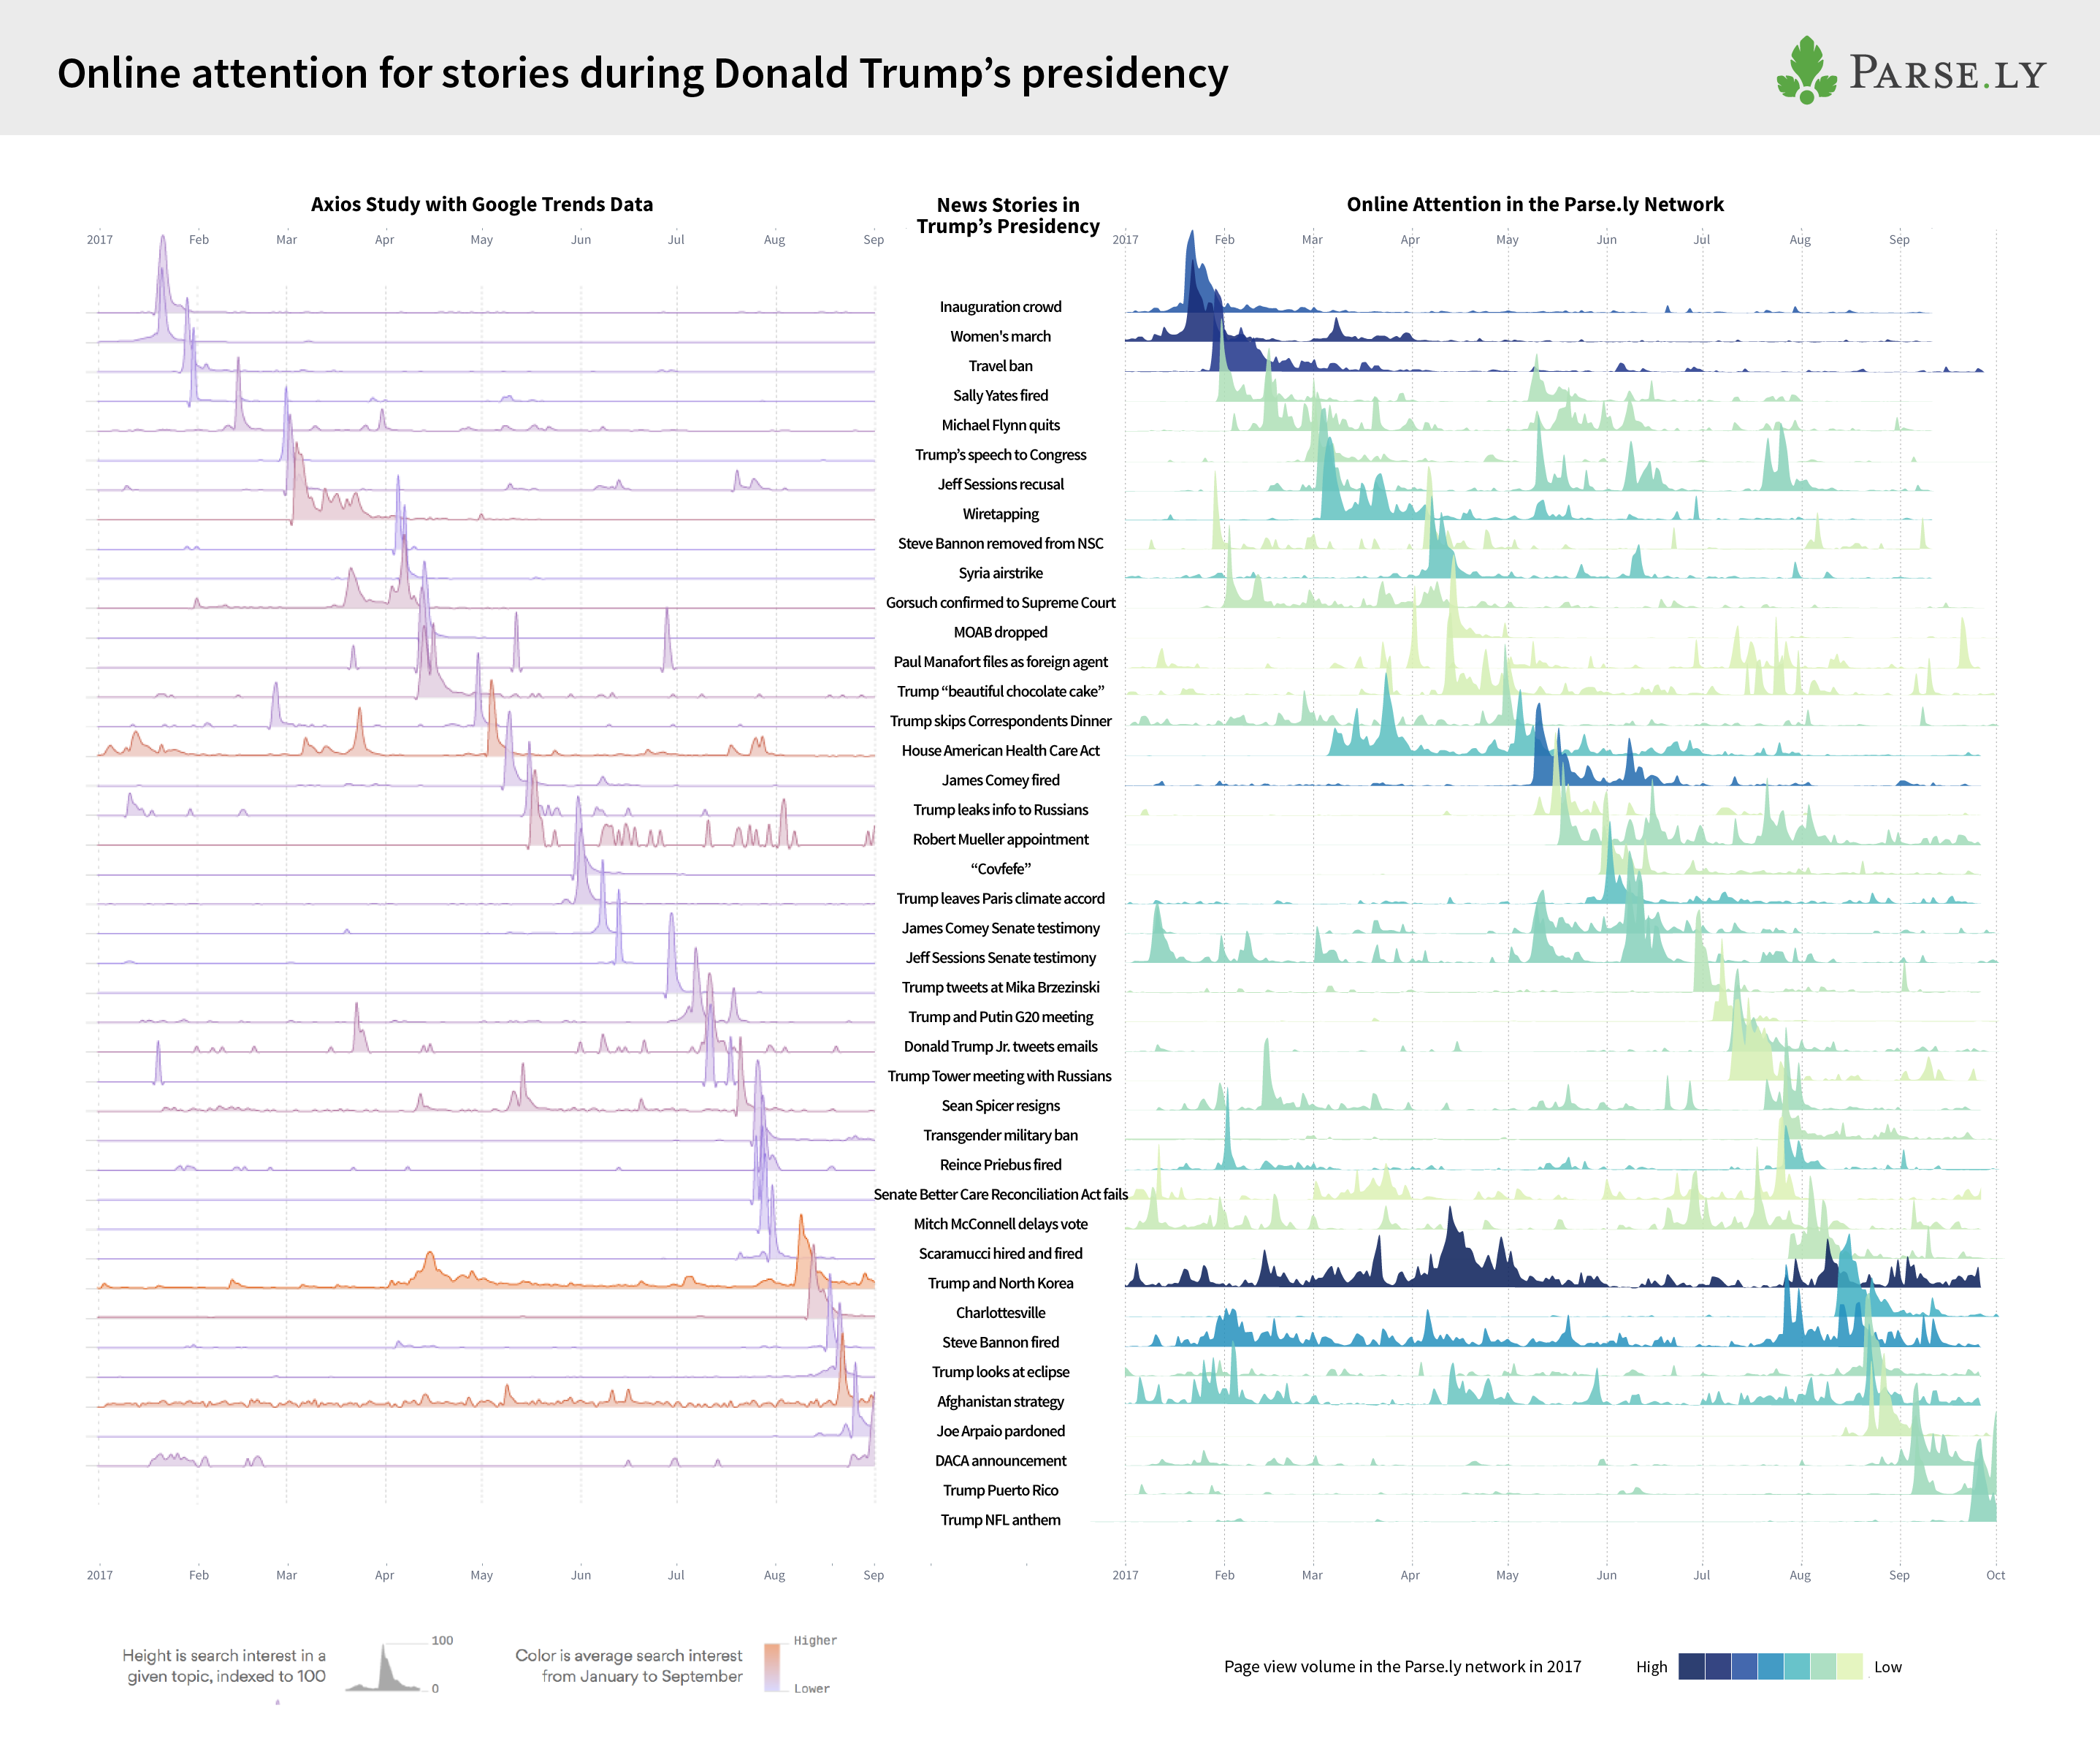
To answer this question, we took the topics in the Axios study and measured the actual traffic they generated in the Parse.ly network. The resulting chart represents reader interest instead of search intent.
Search and attention correlate, but don’t always align
Overall, when keyword searches spike, attention to that story spikes around the same time. For most topics, search seems to be a good leading indicator of initial interest.
The volume of searches did not align completely with the volume of readership. While the Google data found that the women’s march drove the most searched keywords, the highest amount of peak traffic for any topic in this list went to the inauguration crowd size. Another keyword that ranked high on search, “covfefe,” didn’t receive many readers compared to other storylines.
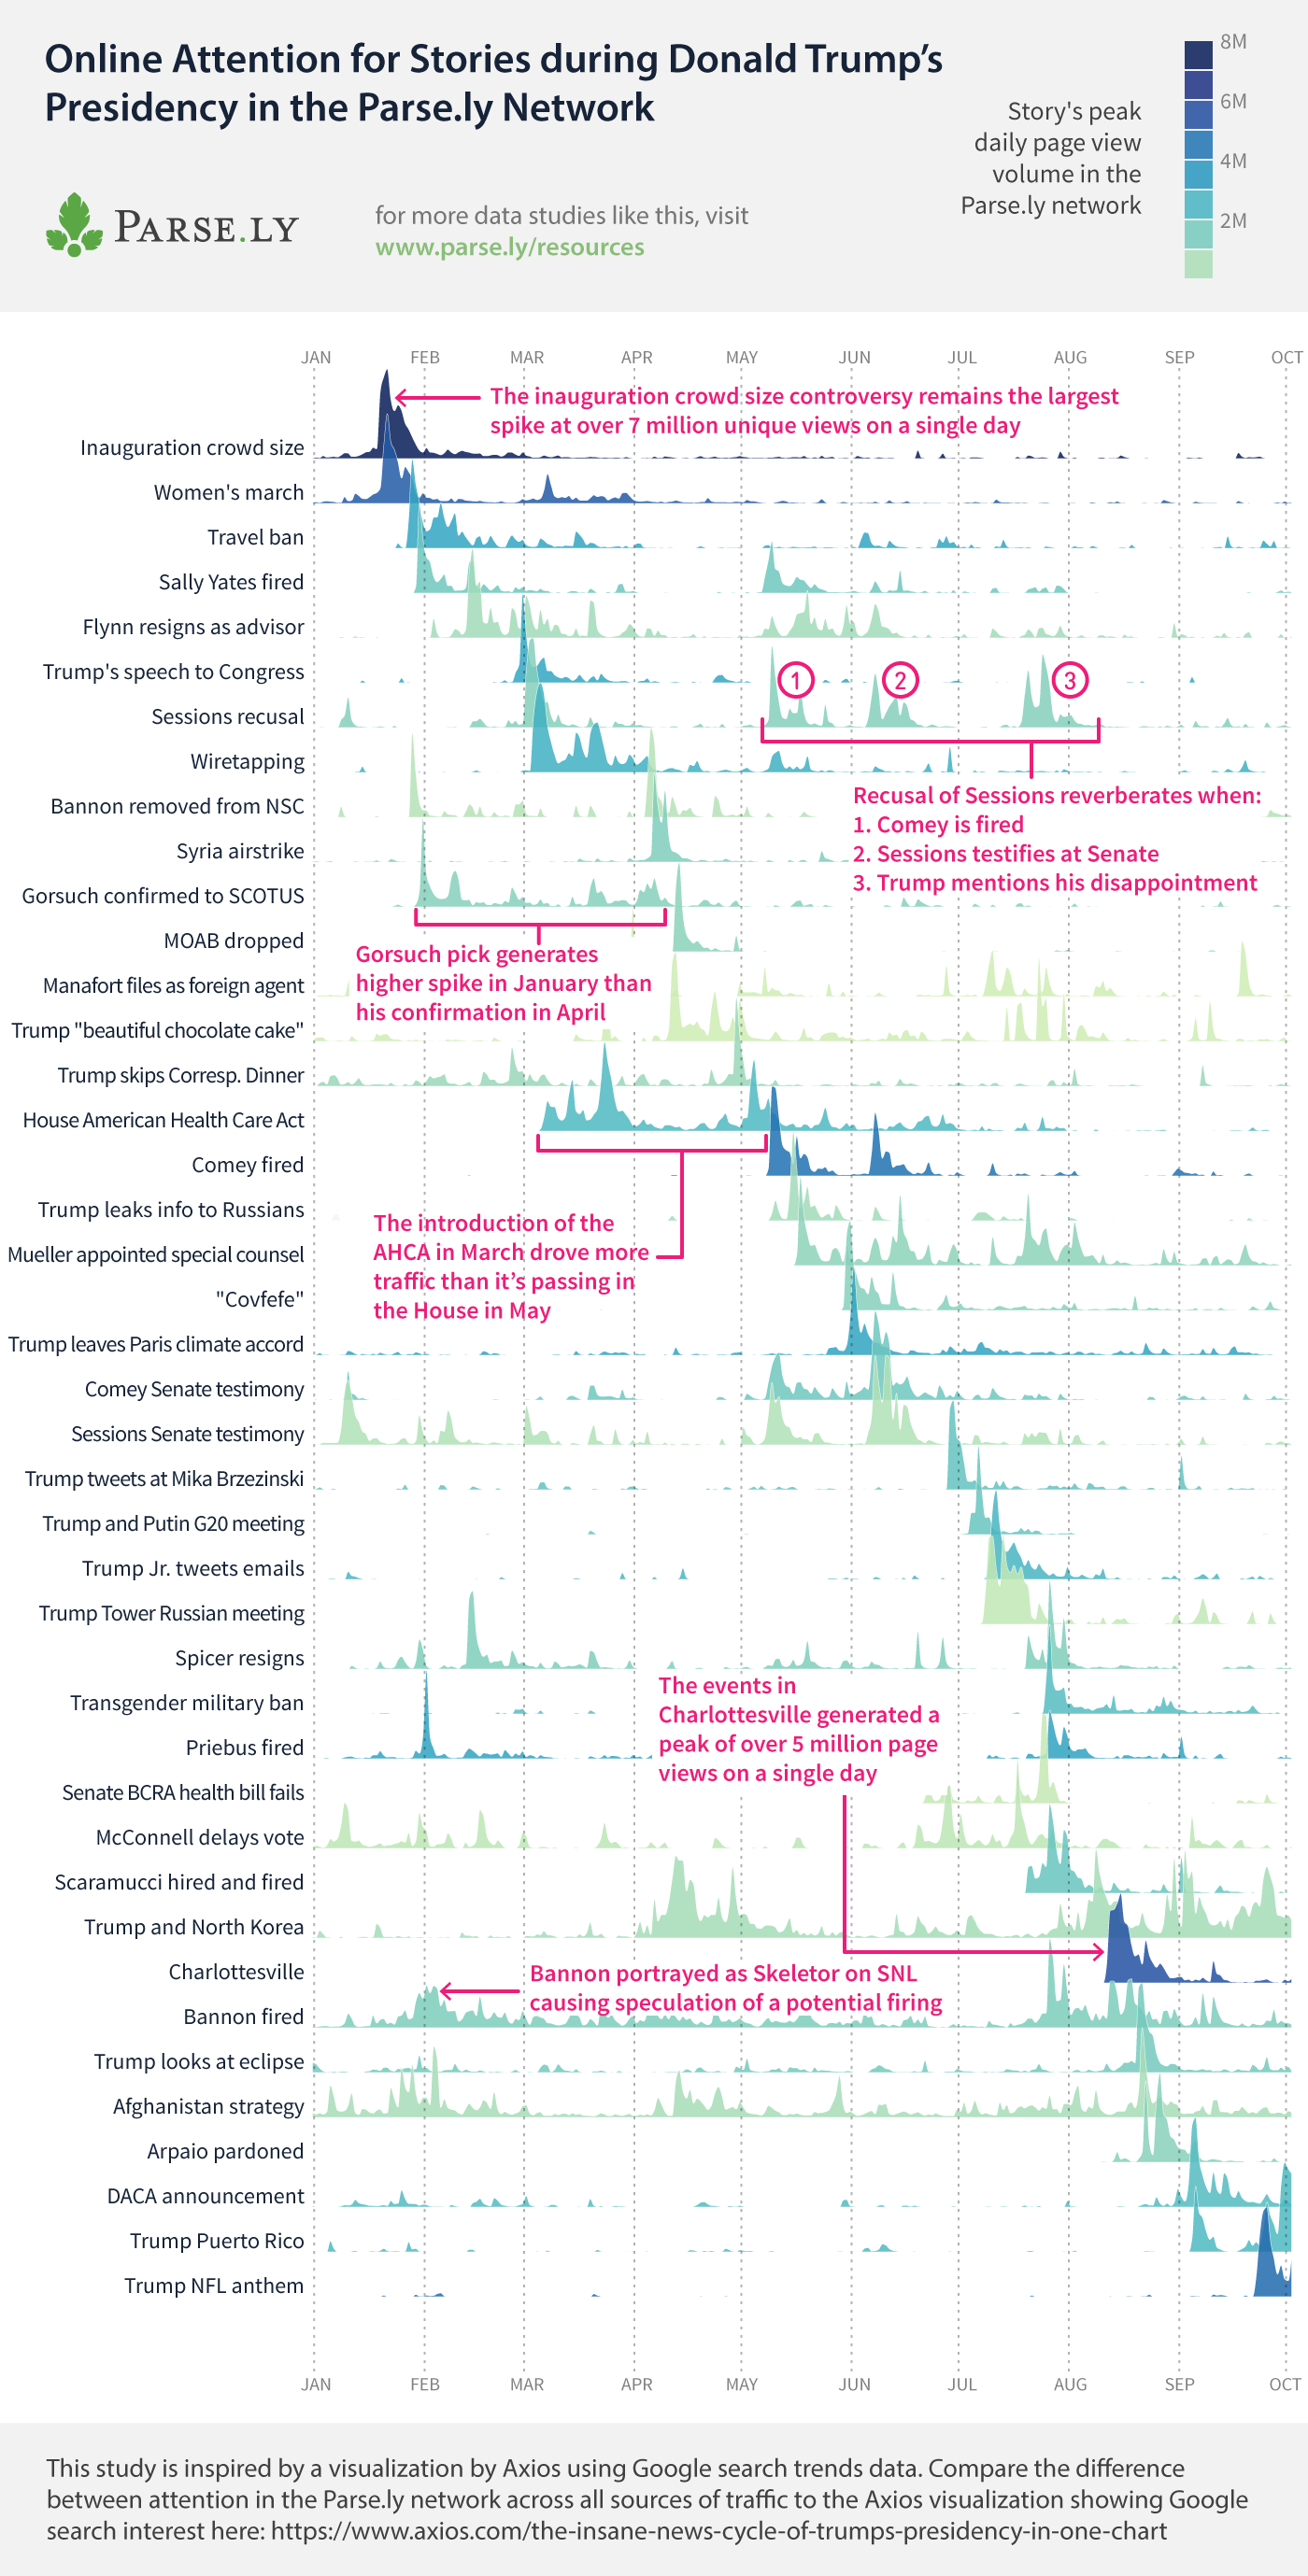
The inauguration crowd size controversy topped our list for the most viewed topic, in terms of articles. The topic generated over 7 million unique page views in a single day. Other topics with the high amounts of readership included the Charlottesville events (5.5 million views in a day), the women’s march, American Health Care Act, and James Comey’s firing.
Certain stories attract an audience before they spike in searches, and most of these topics relate to people, including “Steve Bannon fired” and “Gorsuch confirmed to the supreme court.” North Korea, the recusal of Jeff Sessions, and Robert Mueller’s appointment as special counsel council all seem to be perennial topics where reader interest resurfaces when related stories develop later in the year.
Similar to what we found with referral sources to broader article topics, the relationship between the action a reader takes to find a story changes with the topic of the story. Understanding that relationship at a deeper level means understanding your audience better, a goal we’re all searching for.
Visualizations and data thanks to Kemper Smith.