6 attention-worthy data visualizations that tell stories using time

Sometimes, absorbing new information simply takes too much time (as anyone who has accidentally fallen asleep on a textbook can attest).
Data visualizations can impart new information in an engaging or succinct way that makes your attention worth it. Not only that, but successful data visualizations tell a story. As Harvard Business Review writes, “Visualization in its educational or confirmational role is really a dynamic form of persuasion.”
Here are six examples of attention-worthy data visualizations that don’t just save you time, they tell stories using time.
1. Alaska’s Permafrost Is Thawing, by The New York Times
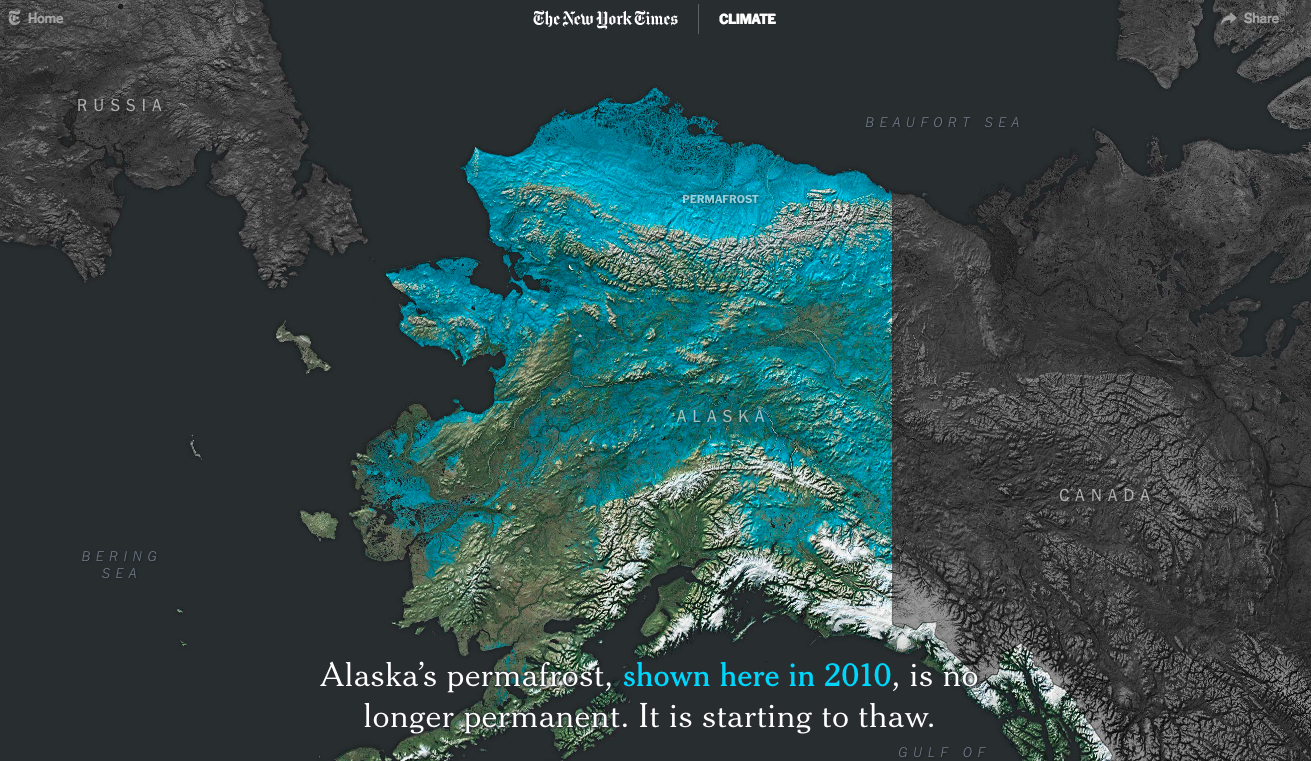
As you scroll through The New York Times article on the Alaska permafrost, the blue area representing the permafrost in 2010 begins to recede. Then, it turns red, representing what might be lost as early as 2050.
2010 – 2050 might seem like a large stretch of time in the span of a single lifetime, but not in the context of global warming. The speed with which the visualization moves from blue to red conveys how quickly the permafrost is melting. The Times communicates the urgency of the situation, underscoring the central argument of the article. Not only is the Alaska permafrost melting, a sign of climate change, but “it is also a cause of more warming to come.”
2. How Music Taste Evolved, by The Pudding
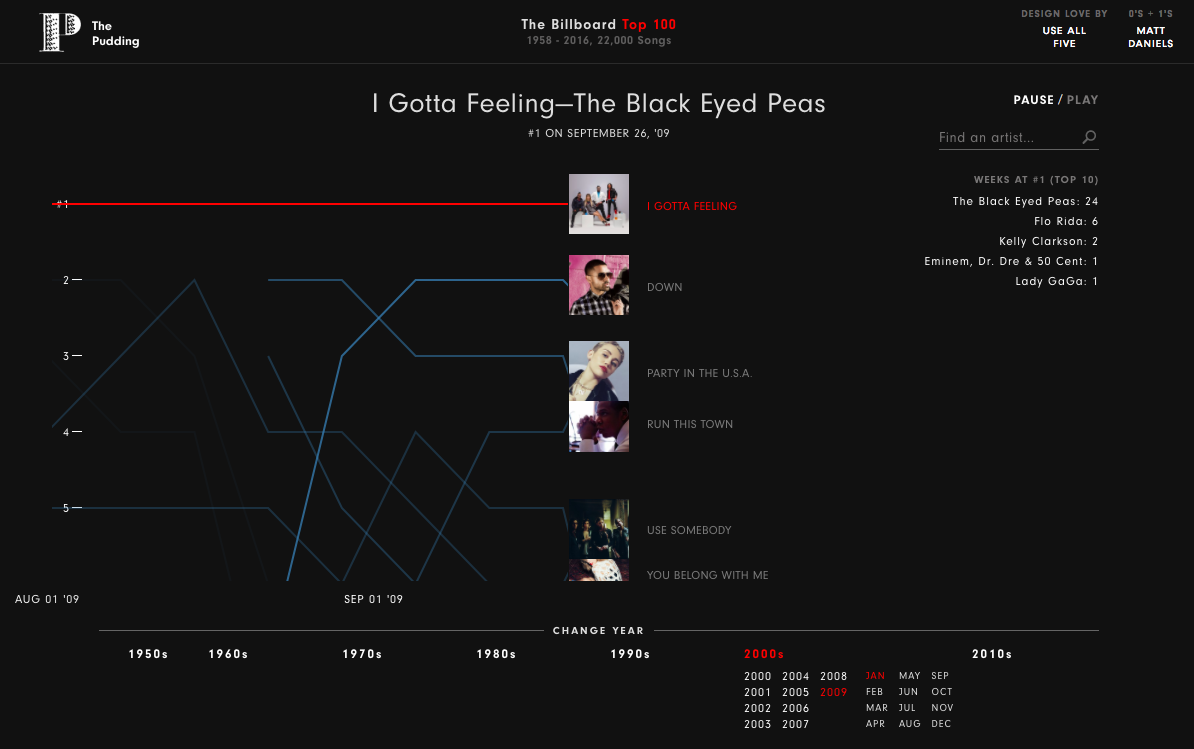
This data viz from The Pudding offers up “every top 5 song, from 1958 – 2016, so we can stop arguing about when music was still good.” The visualization charts the top five songs and provides audio so you don’t have to hum the melody yourself.
As songs move through the ranks from week to week, you hear the #1 song play, with the length of the audio representing the length of time the song spent at the top of the chart. In 1965, only snippets of each song play as they quickly rise and fall to number one. Jumping ahead 50 years, there’s an 11-week plateau in 2015 that subjects the listener to 27 seconds of “Uptown Funk.”
Take in the speed at which some tracks rise and fall, tally the ranking of which artists spent the most time at number one in a year, and hear callbacks to tracks as they fall and then rise to number one again a few weeks later.
As for its confirmational role, the visualization still leaves room for debate as to what constitutes “good” music. (How was “Bills, Bills, Bills” by Destiny’s Child only number one for one week in 1999?! And why was “I Gotta Feeling” by the Black Eyed Peas so popular in 2009? What were we thinking?)
3. This map shows every inch of snow that fell on the lower 48 this year, by The Washington Post
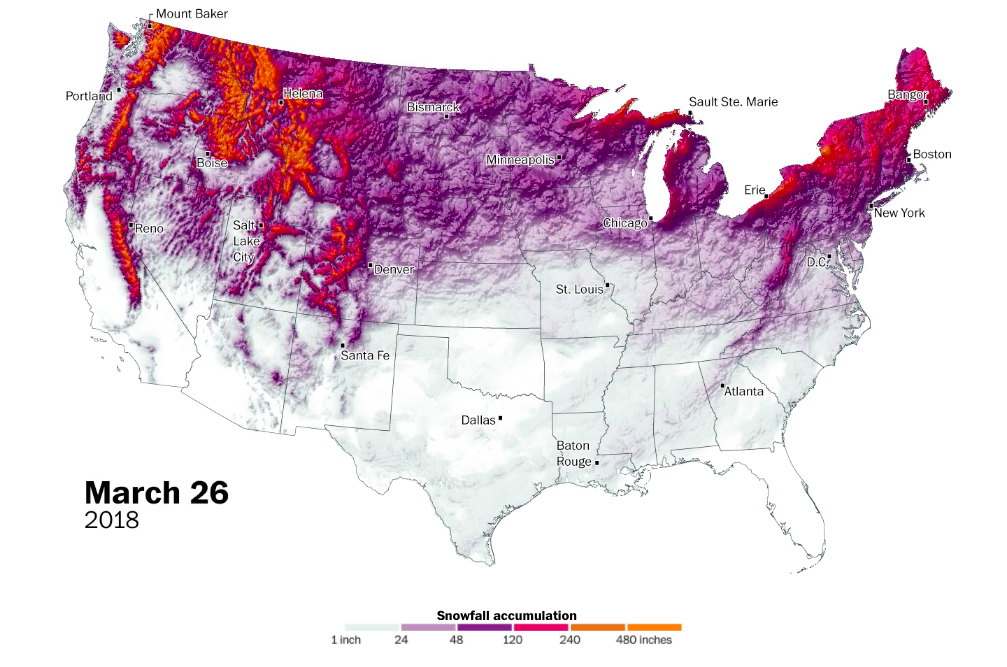
As The Washington Post says in its article about snowfall in the U.S. in 2018, “This winter was one for the record books.” The map shows snow accumulation daily from October to March 2018, revealing which states had storms as the season progressed and emphasizing how extreme this winter was.
The article notes that “Erie, Pa. — no stranger to snow — shattered records in late December when the city got more than four feet of snow in just 30 hours.” Atlanta, which usually only gets three inches of snow on average, had about 10 inches of snow.
The choice of purple, pink, and orange to represent the heaviest snowfall starts to make an impact on the reader as the season continues. The intensity of these snowstorms were felt by those living through them, and now by the readers of The Post.
This piece about snowfall also brings to mind one of the most famous data visualizations and an early example of multi-media reporting, “Snow Fall: The Avalanche at Tunnel Creek” by The New York Times, for which journalist John Branch won a Pulitzer Prize in 2013.
4. The worst flu season in eight years, by Axios
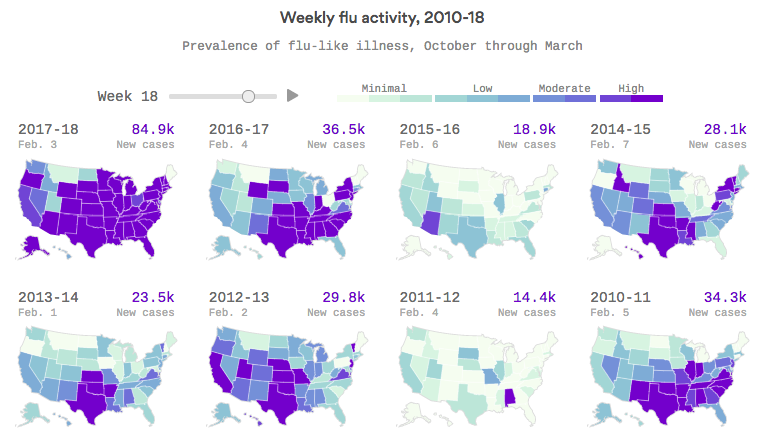
Speaking of extreme winters and maps of the continental US, this was the worst flu season in eight years. Axios’s visualization of data from The Centers for Disease Control and Prevention compares the emergence of influenza-like illness across the United States.
Initially, experts expected the flu season to peak at the end of December of the beginning of January, but the peak didn’t occur until February (Week 18 in the visualization). By layering time and geography, the visual shows both the rise in new cases and the extent to which high prevalence spread across the country.
Every year on the news, we hear stories about the flu and it’s easy to dismiss it. This visual shows that this year, the spread of this illness was far out of the norm, something that is worth paying attention to. Not only that, but Axios offers another reason why the data in this visualization matters. Public health officials use this data to develop the next year’s vaccines and hopefully mitigate the severity of the flu season.
5. Can we talk about the gender pay gap?, by The Washington Post
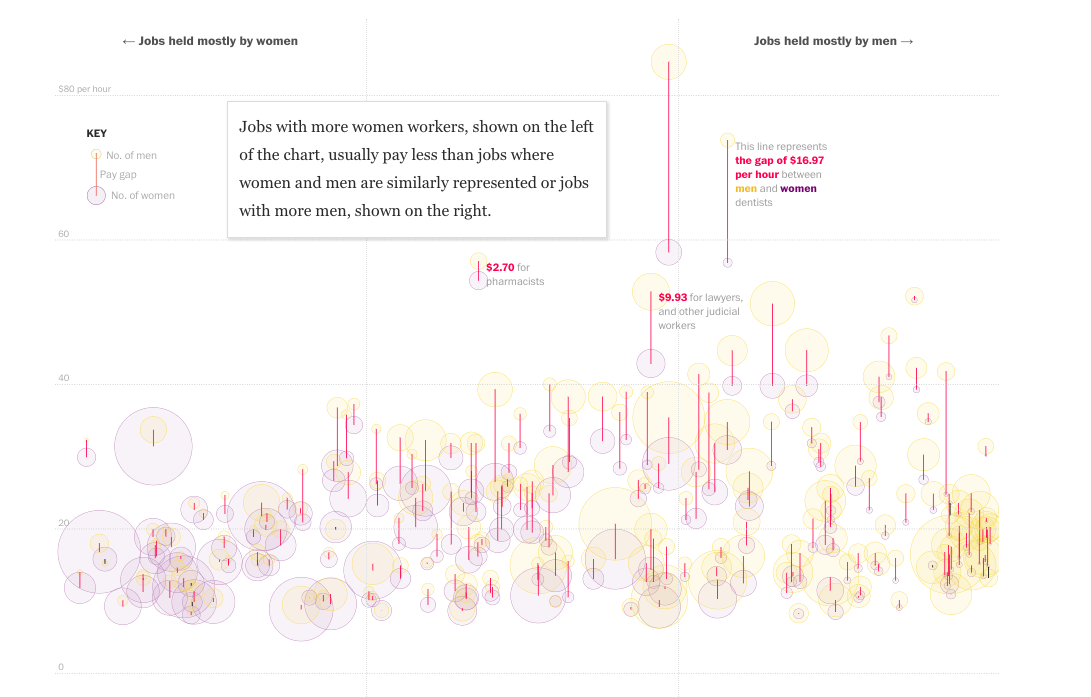
While many of the other examples visualize time in the expanse of weeks or years, this piece from The Washington Post underscores disparities between men and women in hourly pay rates.
The article takes direct aim at common myths about the gap: that “women choose lower-paying jobs” is met with a visualization of the gap in the hourly rate earned by men and women for the same jobs. For elementary and middle school teachers—a job held by more women—men earn $23.57 an hour, women $21.72. For physicians and surgeons—a job held by more men—men earn $84.60 an hour, women $58.24.
When you open the page, a counter starts ticking. By the time you reach the end of the article, you see how much money you would have been paid since you opened this page if you were a man or a woman. While researching this article, I made $13.99 as a woman but would have made $17.08 as man.
6. The Rhythm of Food, by Google News Lab and Truth & Beauty
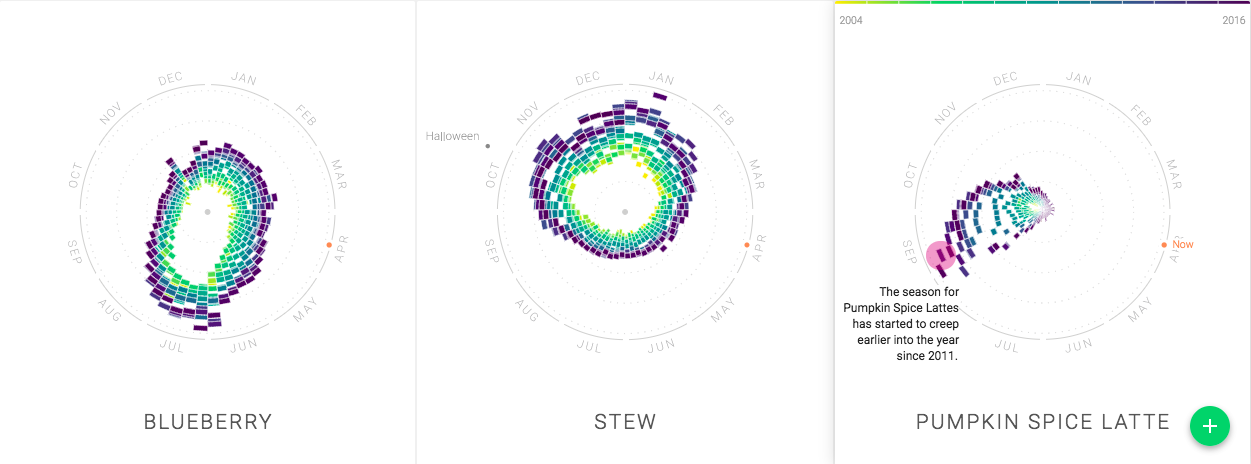
The question isn’t whether people like pumpkin spice lattes, but when. This data visualization, a collaboration between Google News Lab and Truth & Beauty, analyzes patterns in Google search queries to reveal food trends over time. We learn, for instance, that between 2004 and 2016, worldwide Google search volume for “veganism” was on the rise, while searches for “fat-free” declined.
One of the most interesting parts of the visualization plots years’ worth of Google Trends data on a year clock, revealing peak seasons for certain foods. Some foods peak in association with events and holidays. Other foods, like blueberries and pumpkin spice lattes, peak seasonally.
Food is universal, but trends are not. The visualization also shows how seasonality varies around the world. Take apples for example. In general, searches for apples peak in October and November. However, in Russia, searches peak at the end of December because apples are a traditional food for New Year’s Eve.
And now, time for some recommendations
Not only are these data visualizations interesting, but they also tell compelling stories behind the data that might have otherwise been concealed or time-consuming to understand. Are there any visualizations of time that we missed that held your attention? Share them with @parsely on Twitter.