Four things reader attention reveals about travel content

According to Parse.ly’s latest Authority Report data, most lifestyle content, including Style & Fashion, Family & Parenting, and Shopping, gets the majority of its external referrals from Facebook. However, one lifestyle category stands out: Travel. It bucked the Facebook trend, and made us wonder, what else is unique about attention to travel content?
Here are four things that we discovered when looking at attention to articles about travel.
People pay attention to travel disasters
Let’s look at total internet attention to Travel content over the last five months.
From May 1st until now, attention to Travel has remained fairly consistent. However, the huge spike in attention from April to May stands out. During this time frame, Travel was the 6th most viewed category in our network, with 60 million views going to 3,000 articles. It’s possible that season timing influenced some increase of attention; Spring Break trip takers could be reading more.
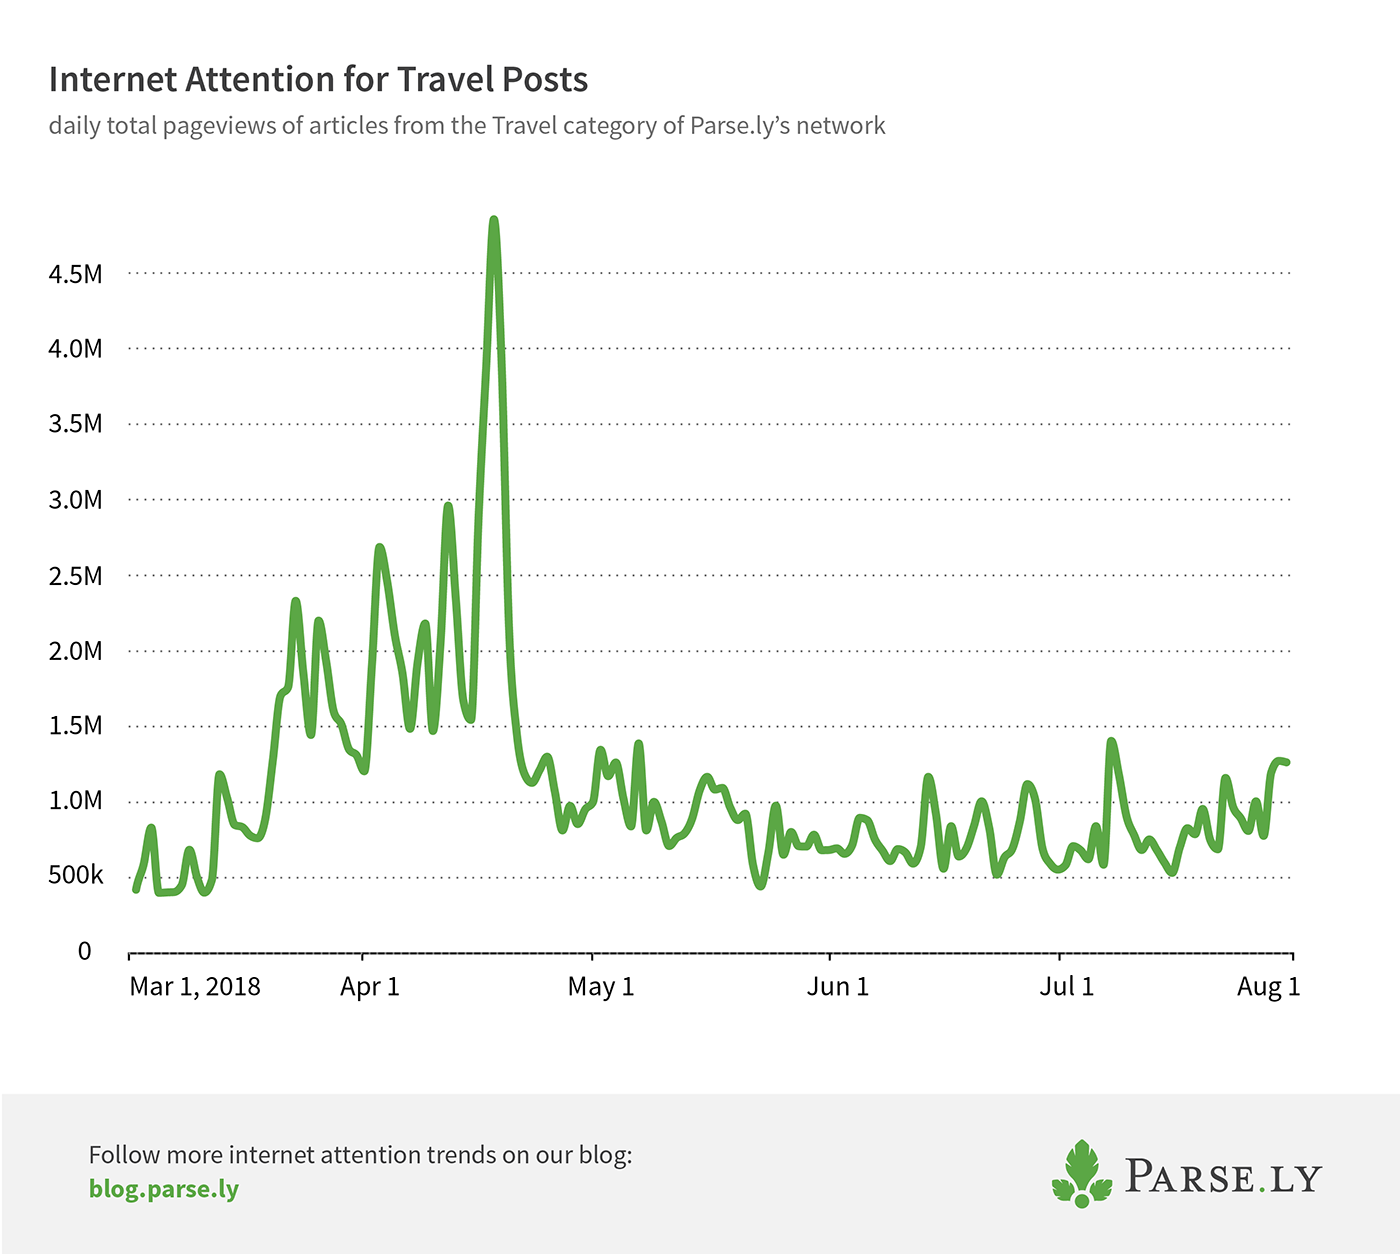
Southwest Airlines flight making an emergency landing in Philadelphia caused the majority of the massive spike in mid-April. With over 4.5 million page views, that story topped the travel category. Emergency landing, National Transportation Safety Board, and Federal Aviation Administration were the top topics for April.
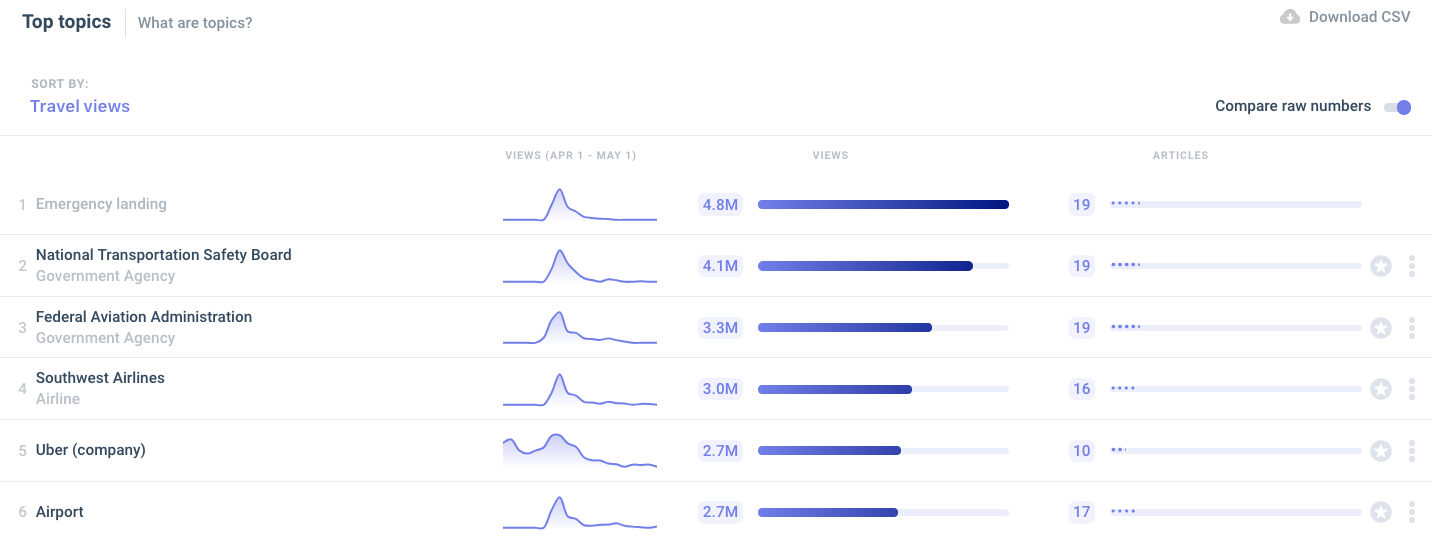
The top topics for content about Travel (Currents data, April 1 — May 1, 2018)
When disaster strikes or airplane passengers behave badly (including the flight attendants) people pay attention, especially considering the number of page views compared to the number of articles written. For example, while there are only eight articles about Emergency landing, the topic garnered over 5 million views. For context, Donald Trump, the top topic in our network, received almost 10 million views in 24 hours, but the topic also had almost 2,000 articles written during that same time period. This emphasizes how people pay attention to travel articles, especially when they are about disasters.
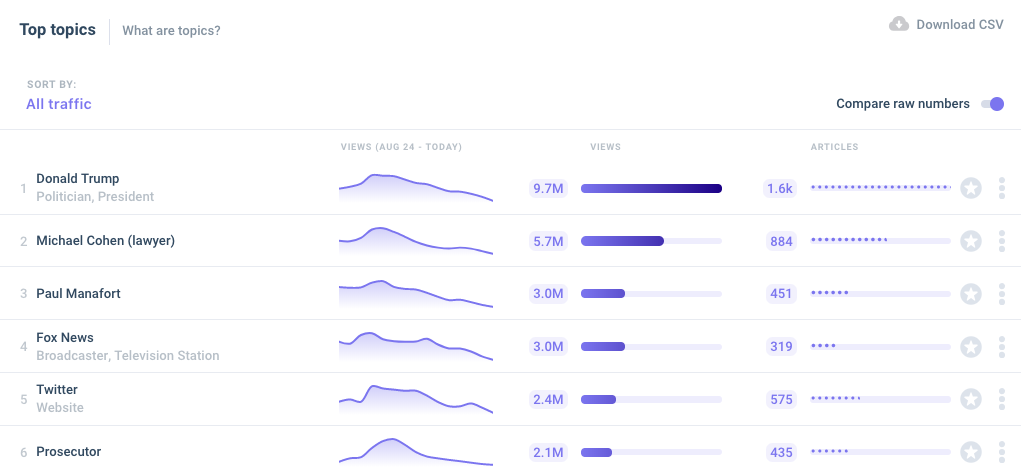
The topic topics in Parse.ly’s network (Currents data, August 24th)
Whether nervous fliers want all the information they can find on worst-case scenarios, or that everyone has had enough bad experiences on airlines to relate with these, travel disasters definitely mean an attention spike—likely to the headaches of comms teams for travel brands everywhere.
Search and Social referrals evenly matched, while Direct traffic reigns for travel content
As mentioned earlier, Travel doesn’t receive the majority of its traffic from Facebook. To distribute your story to the people you want to read it, it’s important you understand where people find travel content.
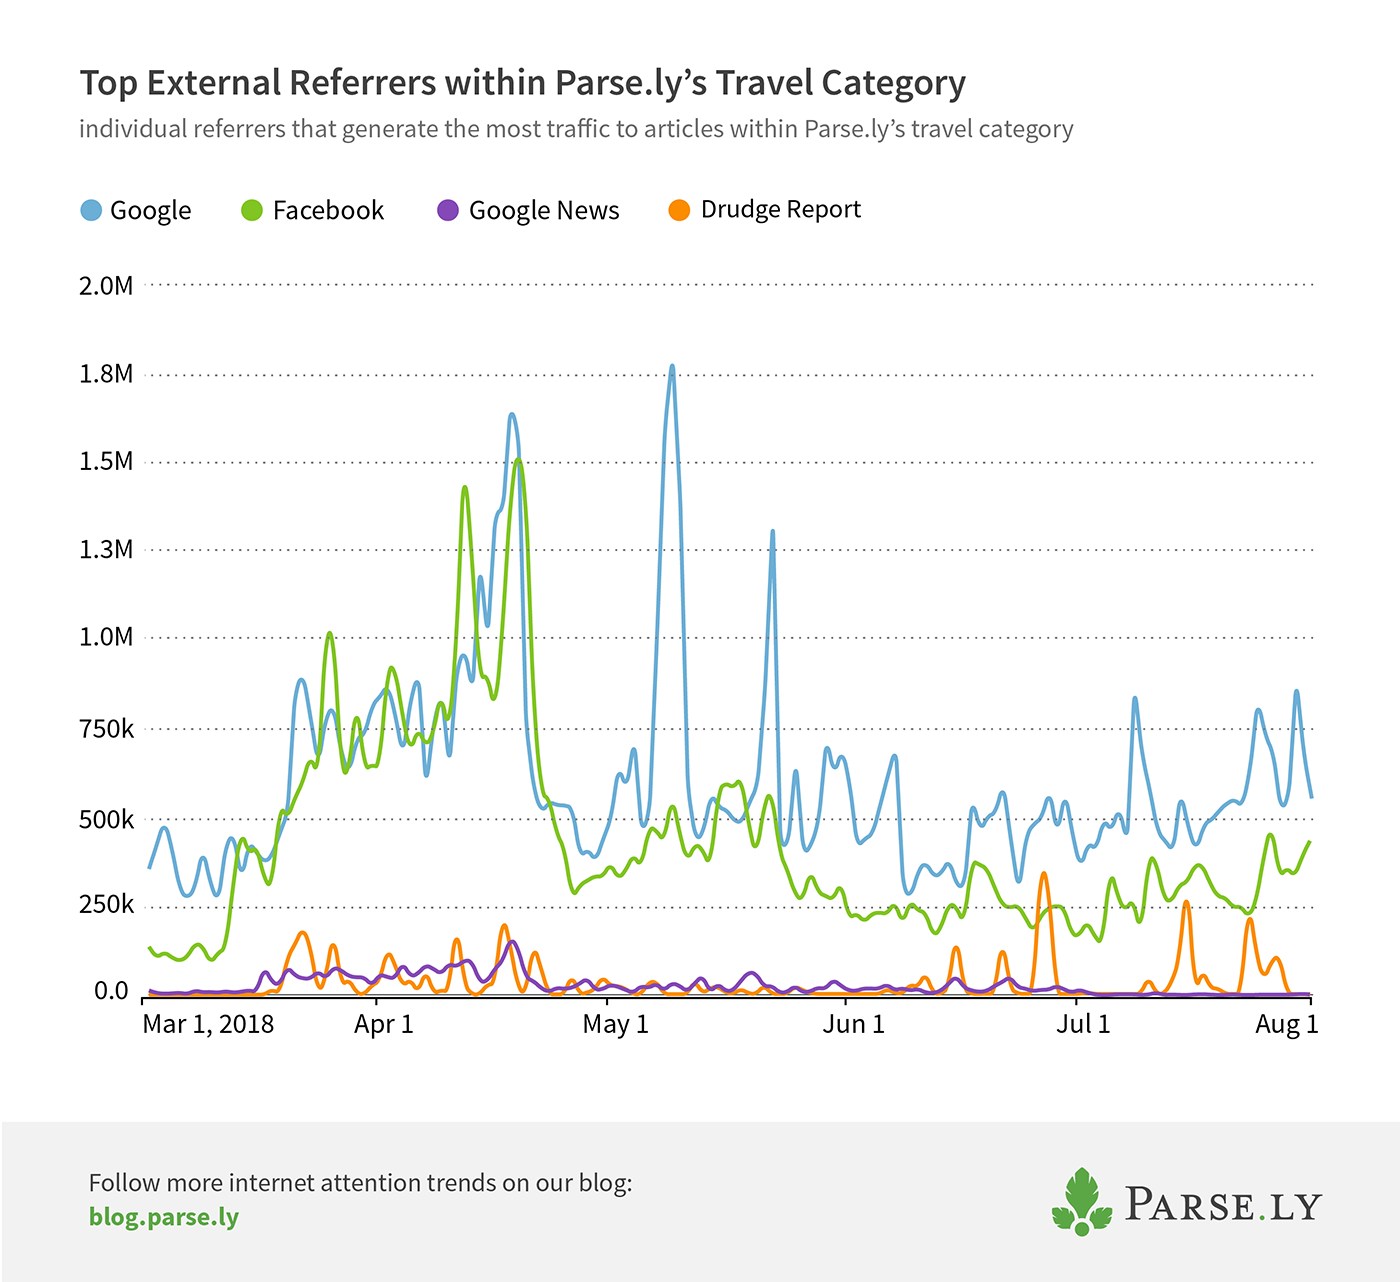
While Facebook and Google Search were sending similar amounts of traffic to Travel content in April, that’s not the case for the rest of the months analyzed. Google Search sent more traffic to Travel content in May than any other external source and continues to be the top external referrer.
However, Social and Search combined only tell half the story, making up less than 50% of referrals to Travel content. So, what about the other 50%?
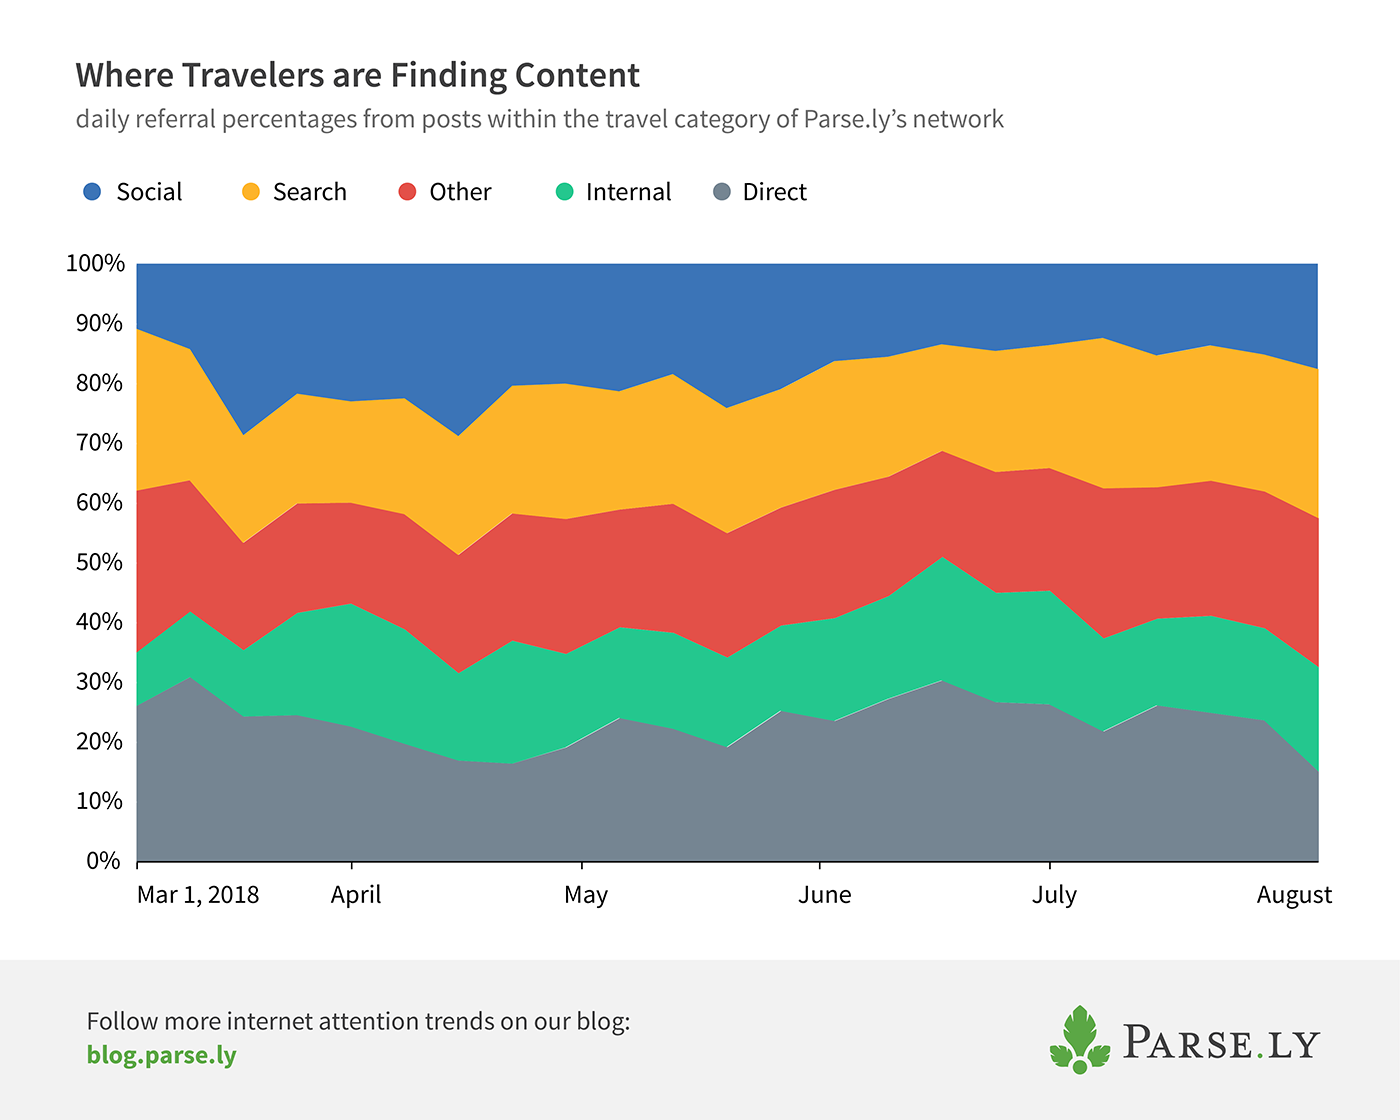
When looking at articles about Travel published across Parse.ly’s network over a five-month period, we found Direct referrals (which include clicking a link in email, SMS message, or app, or visiting a story by pasting the URL in a browser) were most influential in leading audiences to travel content. Compare this to all traffic in Parse.ly’s network in the last 90 days: Search is most influential, sending 31.3% of traffic to articles.
For this category and audience, direct newsletters, email offers, and SMS or in-app messages drive attention, something anyone trying to reach this audience might want to consider in their strategy and distribution channels.
67% of audiences access Travel content via mobile devices
As recently as 2013, peak daily mobile usage only accounted for 20% of traffic. At the beginning of 2018, we found mobile and tablets drive 73% of traffic to Parse.ly’s network, all content categories considered. It turns out the mobile-dominated trend rings true for attention to Travel content, too.
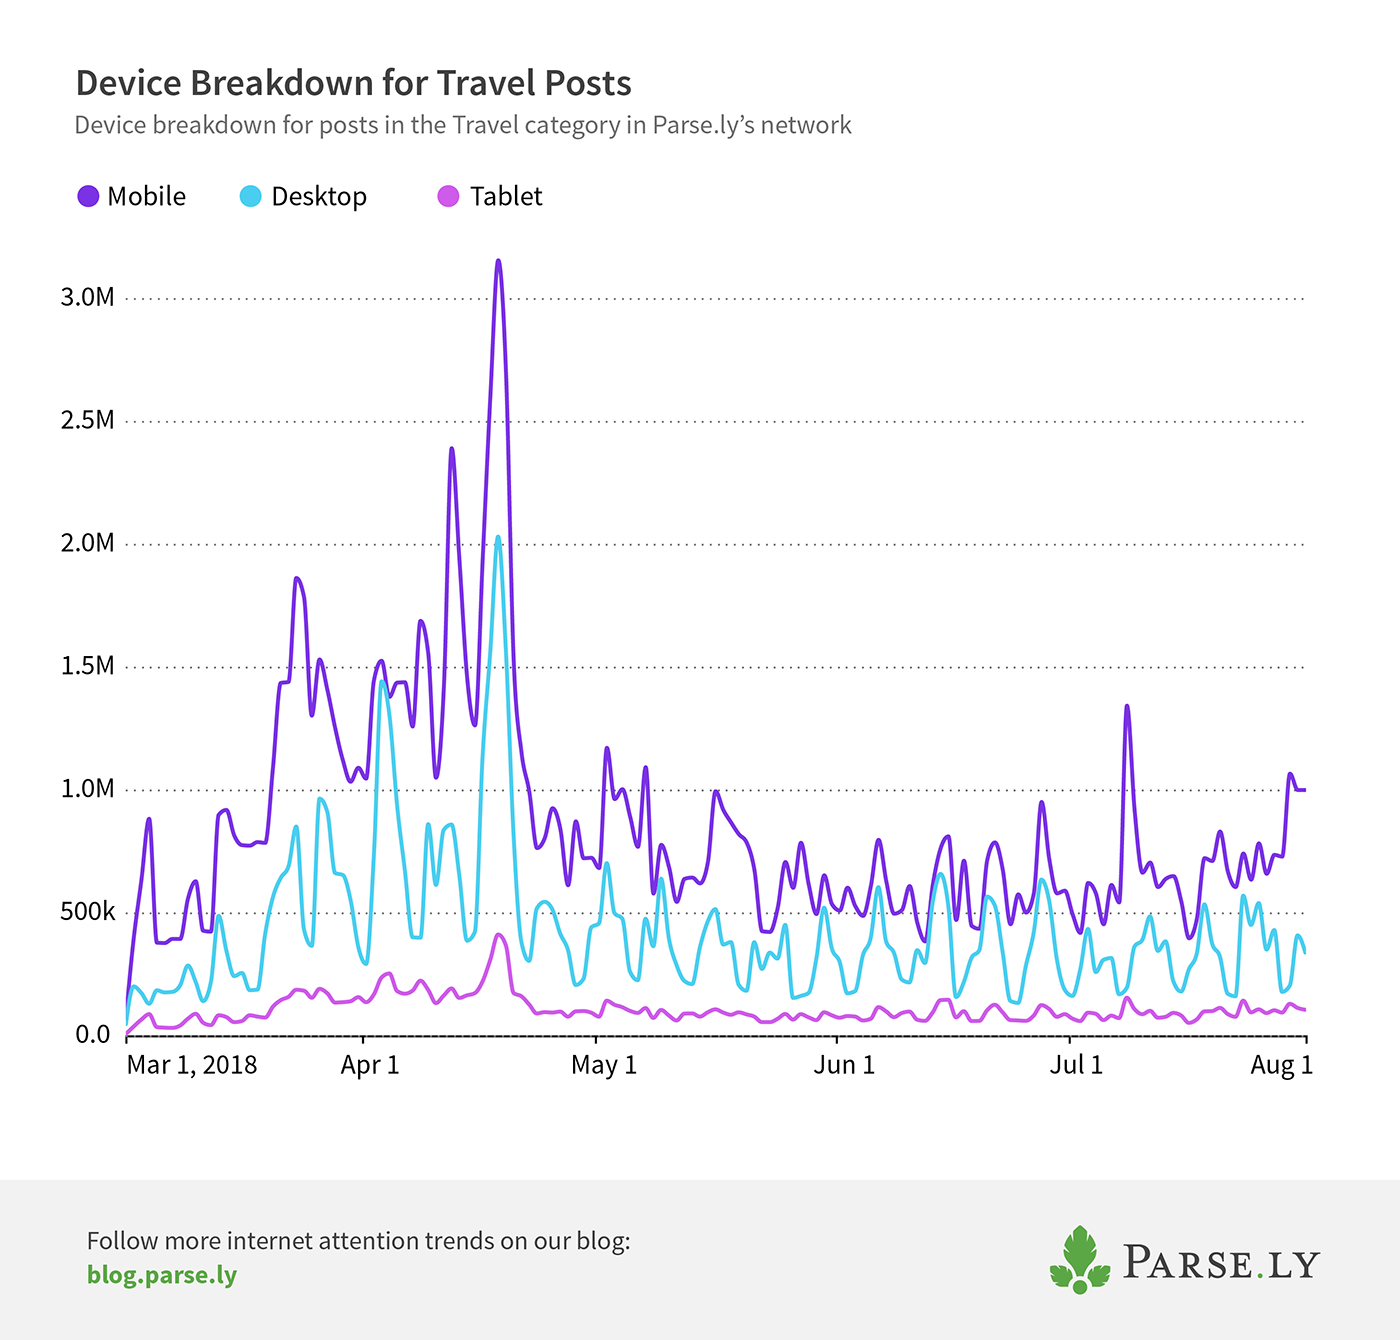
On average, audiences access approximately 67% of Travel content via mobile devices. That’s slightly higher than all content accessed via mobile devices (63%) in Parse.ly’s network. This could be indicative of the on-the-go behavior of travelers—they also want to access content on-the-go. For travel marketers, you’d better be sure to optimize your content for mobile, as well as desktop.
People are 42% more likely to read Travel content on Wednesday than Saturday
During the workweek, do you catch yourself daydreaming about your next planned vacation or fantasizing about where you’d like to travel? If so, you’re not alone.
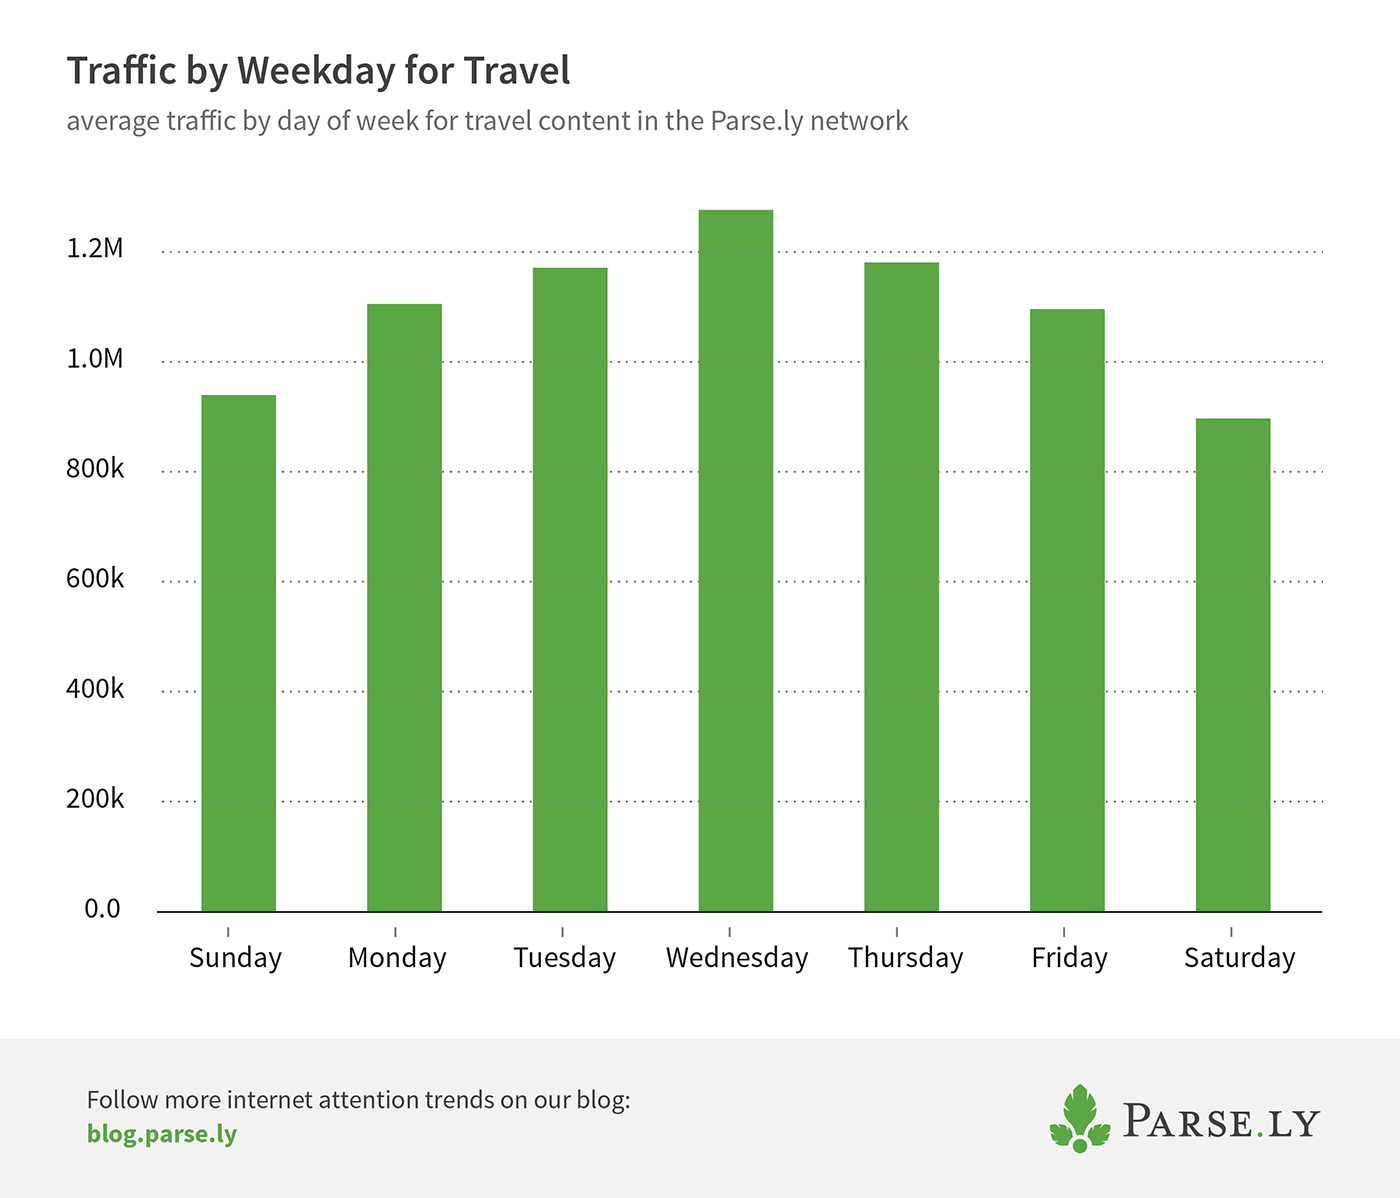
Throughout the week, traffic to Travel content steadily increases, peaks on Wednesdays, and decreases toward the end of the week. Audiences are 42% more likely to read an article about Travel on a Wednesday (the weekday with the most traffic) than on Saturday (the weekday with the least amount of traffic).
Perhaps people get ready for the weekend by Googling or emailing each other travel information on Wednesdays? It makes hump day more manageable when you’re dreaming of tropical breezes. Whatever the reason for the trend, this audience carves their own path with attention, and one that means anyone trying to reach them should keep an eye out for these patterns.
The Parse.ly data in this post derives from Currents, a new product that shows the attention of over 1 billion people each month and 850,000 viewed articles each day. Learn more about Currents and explore the data for yourself.