Benchmark your site against overall attention trends
There’s a reason explainer posts get read and shared so much: we all want to know someone else’s secret to success. “How this one company solved that exact thing you’ve been struggling with” means you can learn from someone else’s efforts without having to fail at the same thing they did.
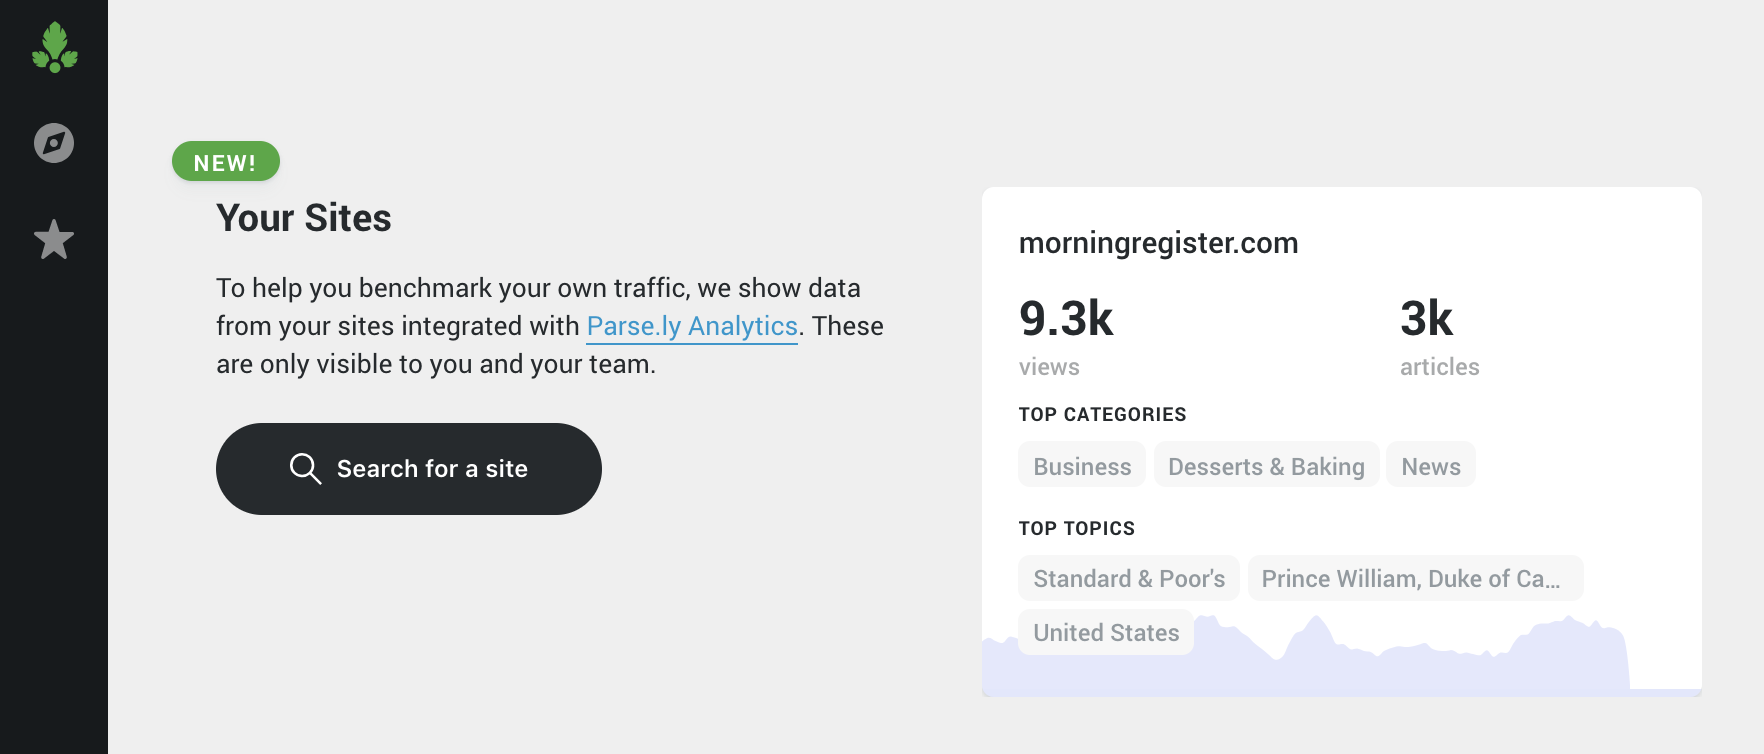
We’re excited to introduce the ultimate way to learn from other audience development and growth teams: Parse.ly Analytics users now have the ability to benchmark their own sites against general attention trends in Currents.
Note: Your site traffic in Currents will not exactly match your traffic in the Analytics dashboard. Currents only shows traffic to articles and samples data to keep things speedy.
It’s like having a conversation with 400 audience development pros, or swapping ideas with thousands of other politics editors. With an understanding of how your site fits into the wider ecosystem of attention, you can make educated decisions about what coverage and distribution strategies you want to explore next.
Here are a few ways you put your site data to use in Currents.
Rethink your competition
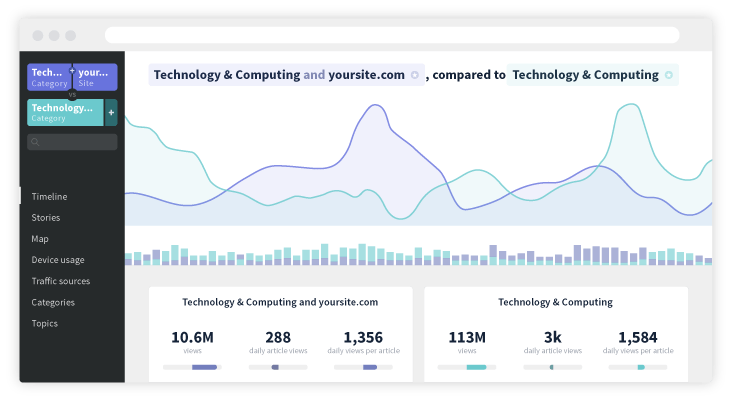
Your competition isn’t limited to the brands you usually consider as part of your “competitive set.” Your competition is anyone covering the same topics as you. With Currents, it’s simple to see how your coverage compares to overall attention for the same subject.
If your company uses Parse.ly Analytics, you can now combine your site with a category to see trends for just the business, fashion, or politics content on that site. Since Currents categorizes content using machine learning and natural language processing, you don’t have to rely on your own tagging taxonomy, site structure, or CMS.
Let’s say you work for a site called TechToday.com. You can compare the audience for all the tech articles on TechToday.com to the audience for all tech articles. This side-by-side view makes it easy to see your strengths and weaknesses.
For instance, during the time period selected there’s a clear appetite for tech content in the Pacific Northwest generally, meaning there’s an opportunity for techtoday.com to develop ways to reach those audiences. The team at TechToday.com might consider running targeted ads for their tech content in the Pacific Northwest market areas or increase coverage of companies with operations there.
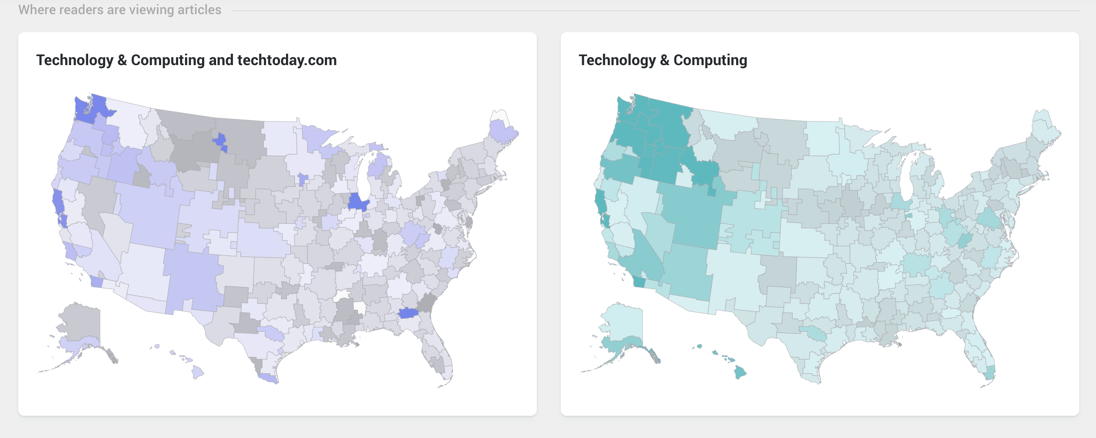
Left: Attention for articles about tech on your website. Right: Attention for all articles about tech.
Over the same time period, TechToday.com’s tech articles got far less traffic from social media platforms than all tech articles, but fared better in Editorial & Recirculation.
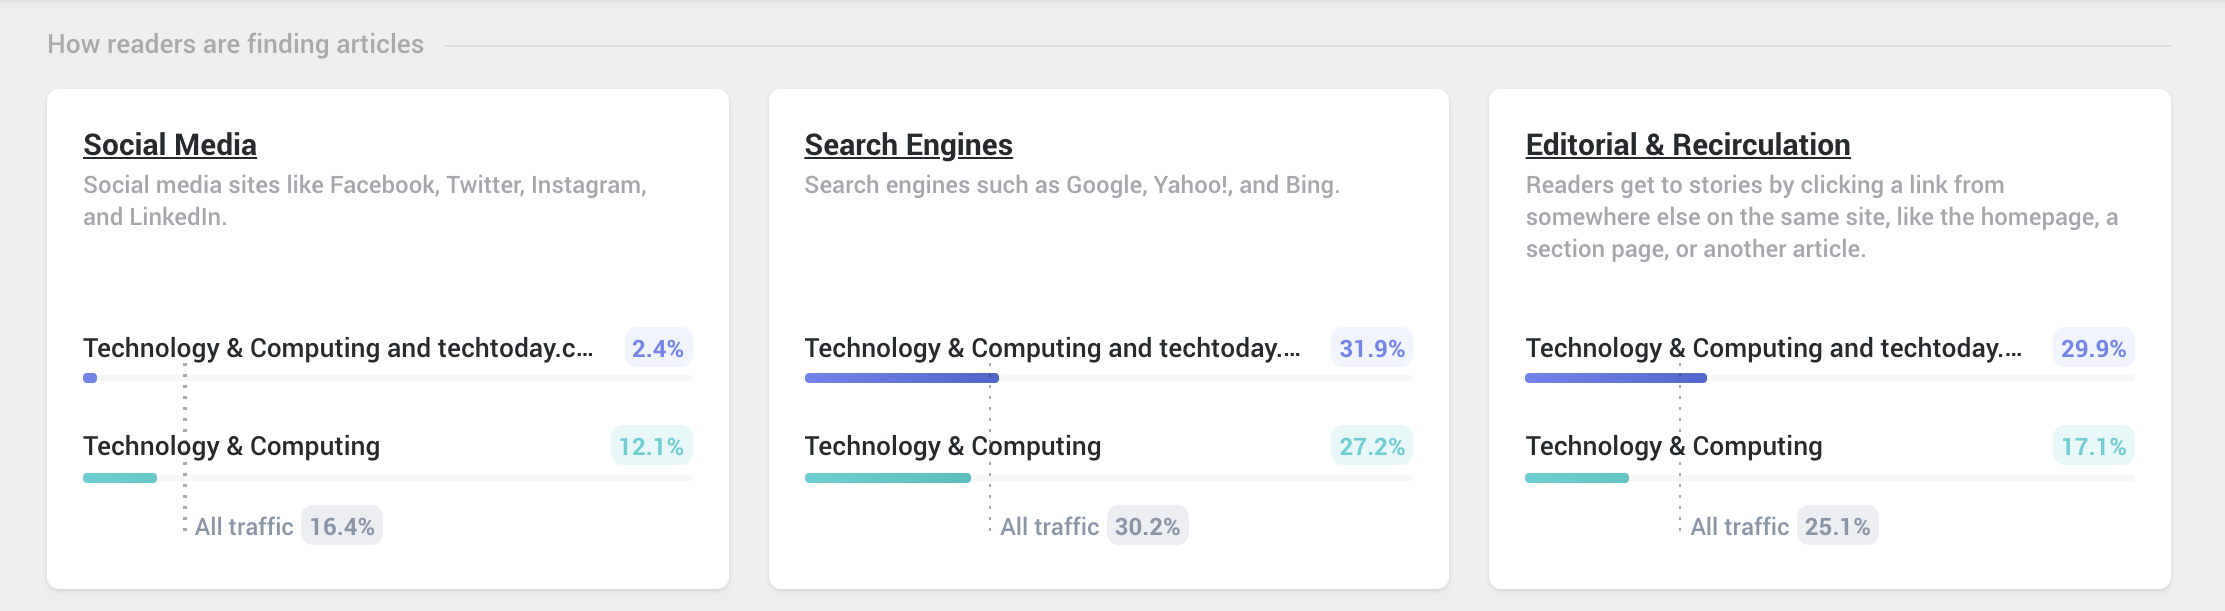
These referral patterns indicate that:
- TechToday has an opportunity to capitalize on the attention for tech content on social media.
- Visitors are finding more tech content via TechToday’s homepage, section pages, and content recommendations than visitors to typical tech articles on other sites.
Check out this video to get step-by-step instructions for comparing your site in Currents:
Vet potential audiences and opportunities for new projects
Only looking at your own audience tells you a lot about what is and isn’t working now, but it can be a little harder to use it to predict how successful new initiatives will be—and experimenting is essential for all companies in today’s fast-changing environments. Knowing the potential audience size ahead of time can give you a huge advantage in picking winning projects.
By using complex queries to combine each market area with the Sports category and comparing them, we can see that more sports articles are read in Dallas and Houston than Austin for most of October.
Currents users on Pro and Enterprise plans can use a query like this to answer questions like: should a U.S. sports site expand its coverage to Austin, Dallas, or Houston first?
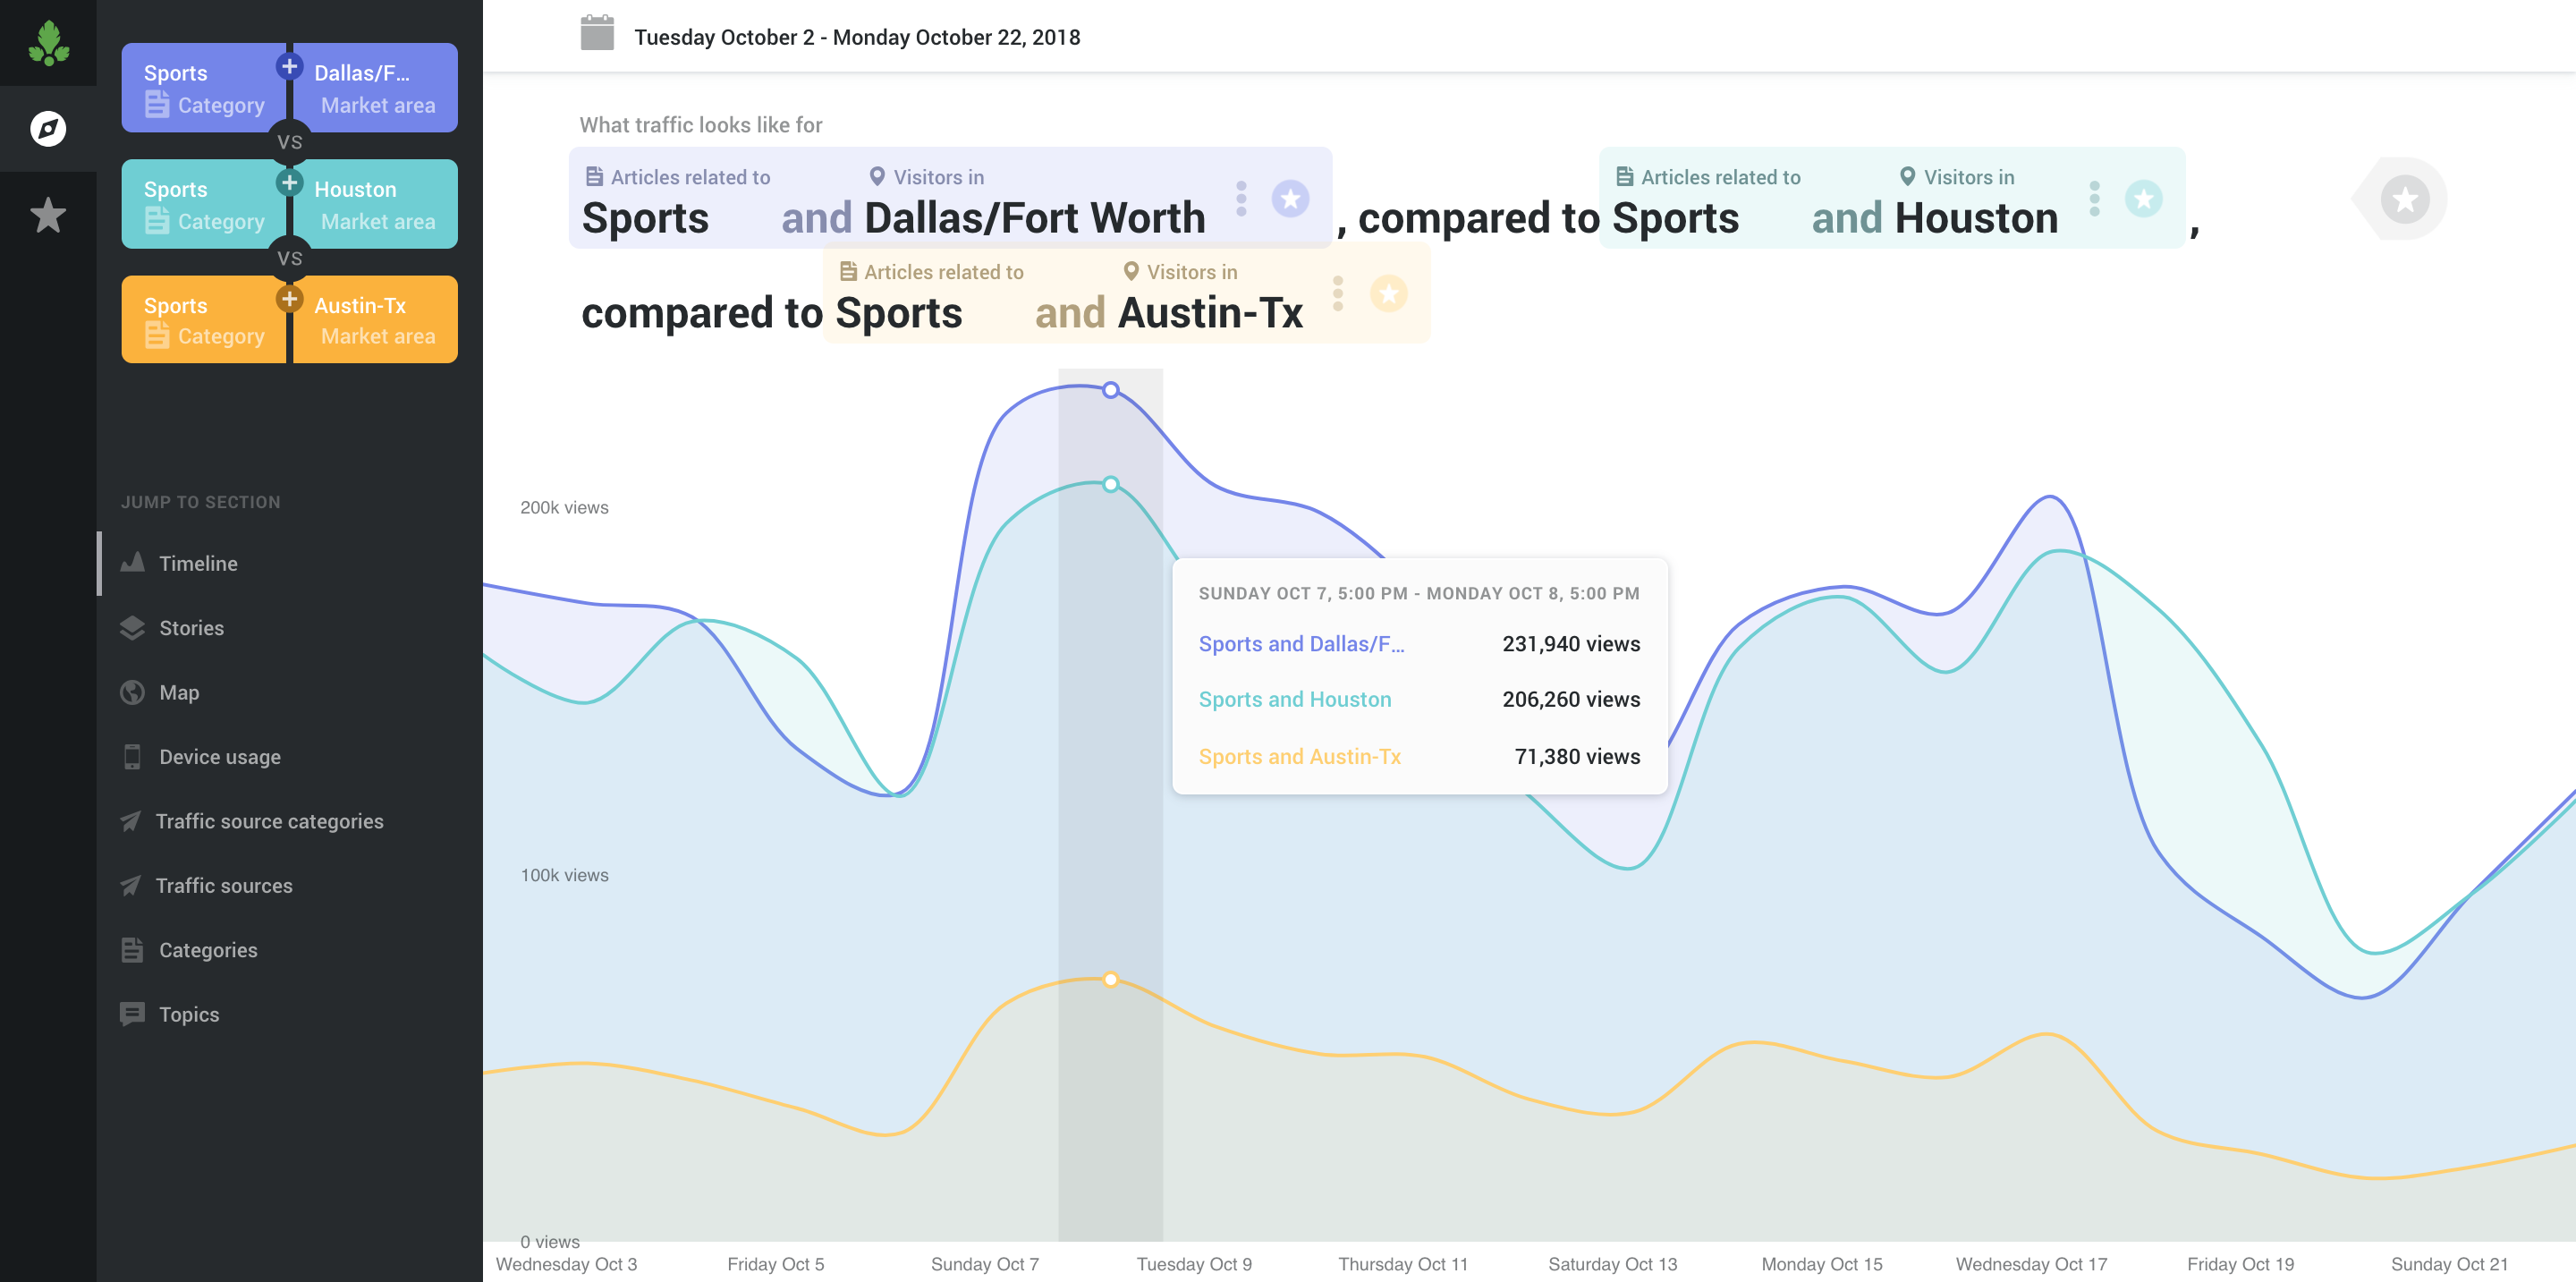
Since traffic to sports articles in Austin is less than half of that in Dallas and Houston, the latter two might be better bets for initial expansion into Texas.
You can also see trends for different types of content in U.S. states. Check out the video below to learn more about using complex queries in Currents:
Figure out what’s “normal” for similarly-sized sites
Sometimes when you hear how a huge site made a change, it’s not as helpful because you write for a niche audience. Or maybe a small site implemented a social strategy you know would never work at your giant corporate media company. Seeing your site side-by-side with sites of your size doesn’t just show you when you do better than “your normal”—it can show when you do better than everyone’s normal.
Currents now shows stats for average small, medium, large, and xlarge sites. Compare your site to a similarly-sized site and look for moments when attention to your site spiked above the average. Then ask yourself, “What was different about that day?”
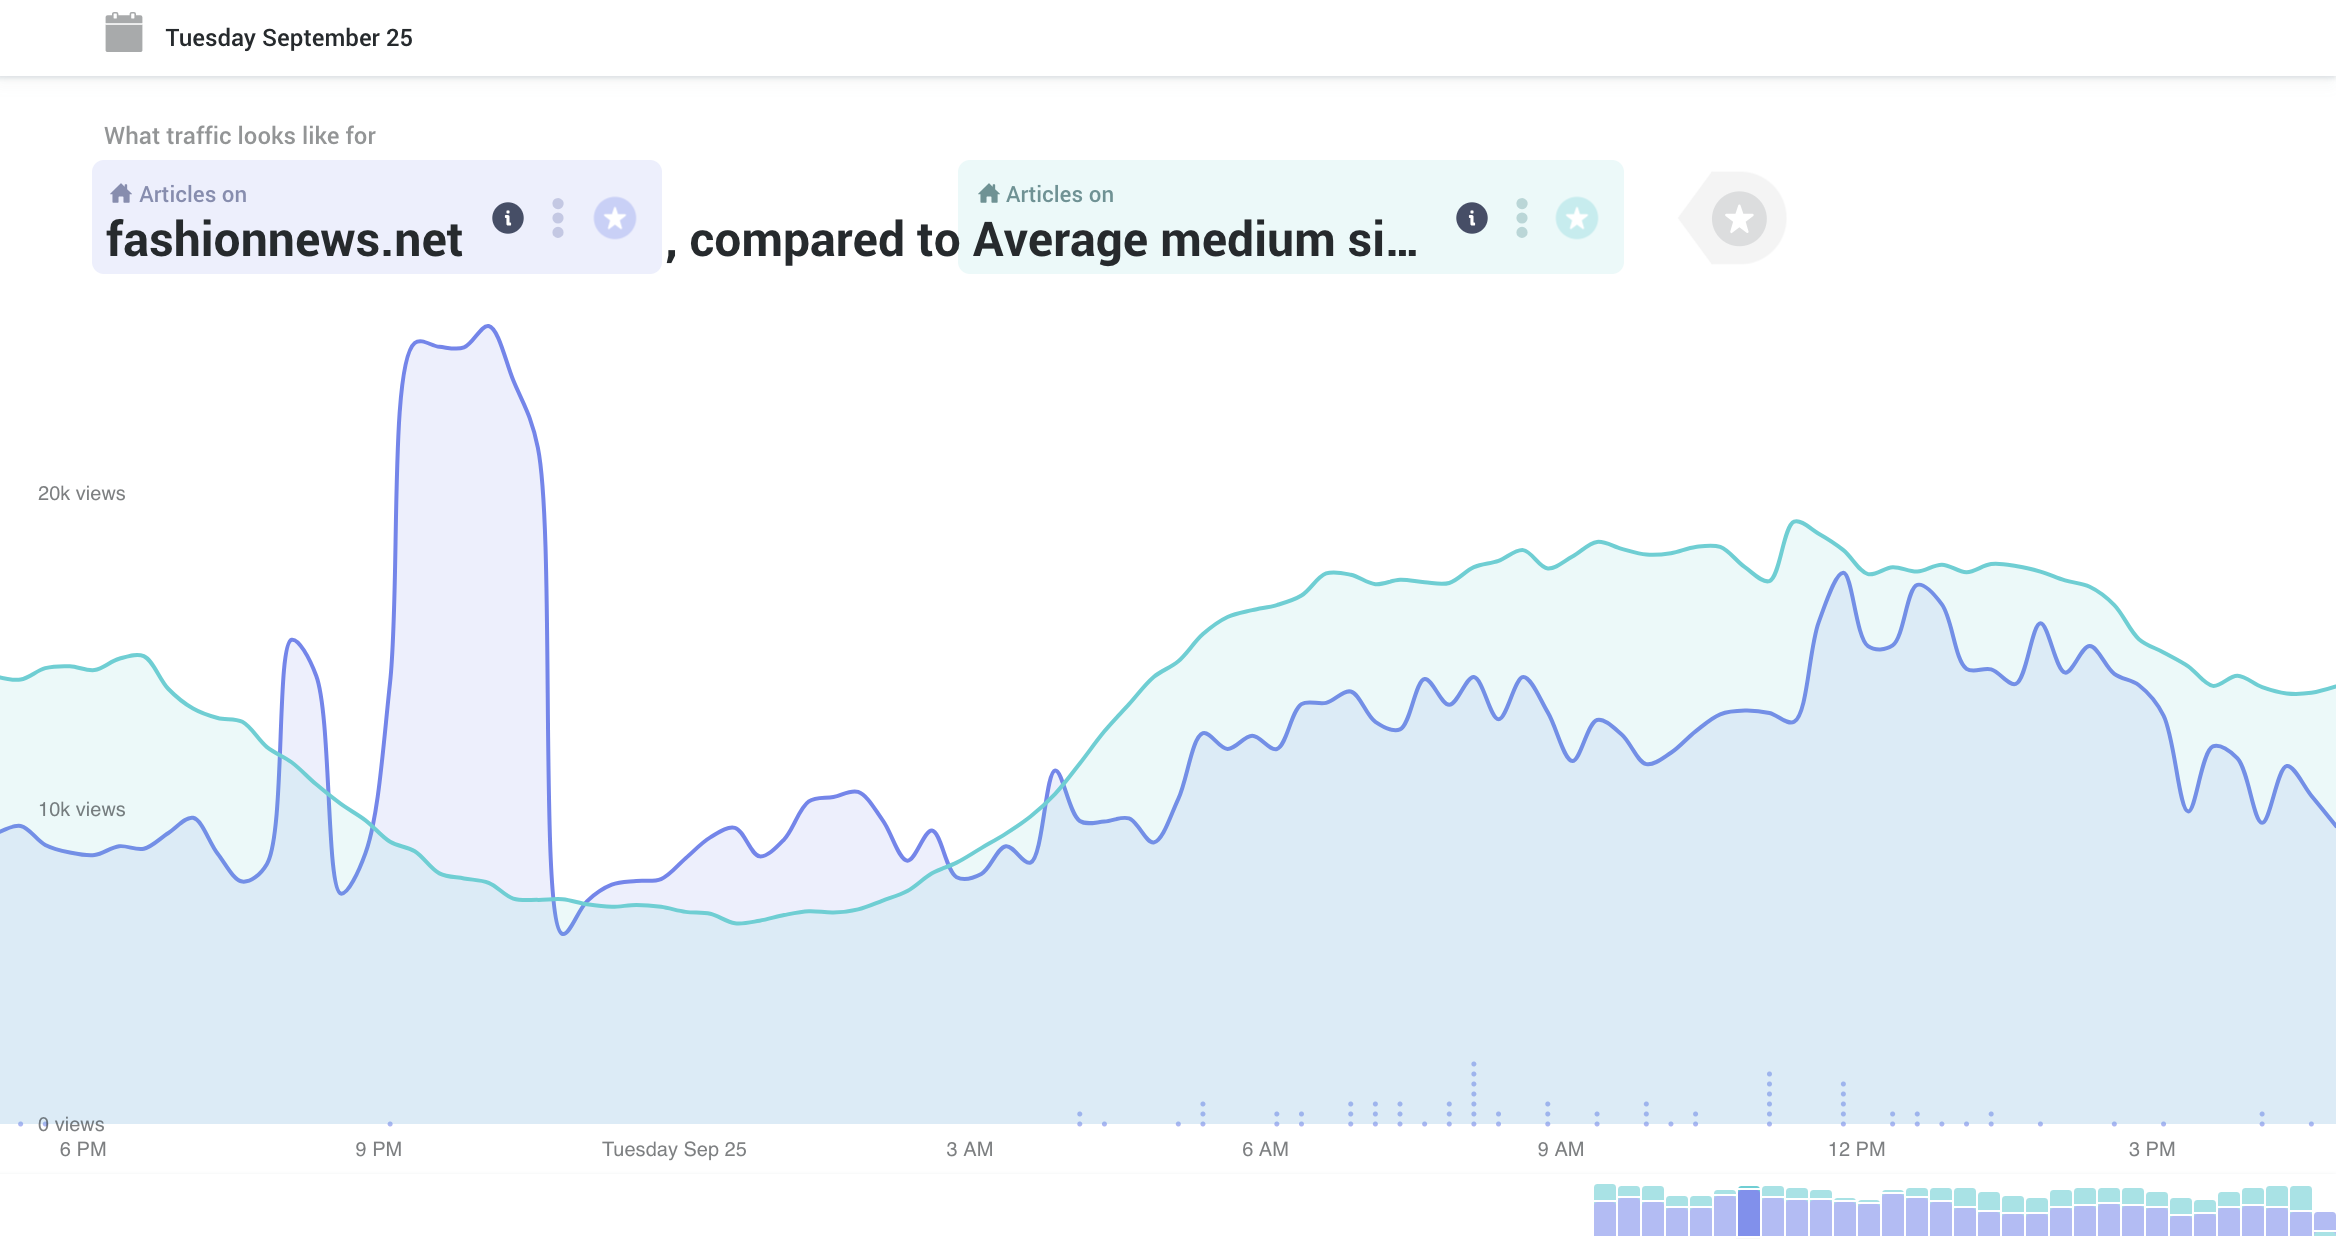
For instance, say you work for a medium-sized site that mostly covers fashion news. You notice your site’s traffic exceeded that of the average medium-sized site on September 25.
When you drill down into that day, your site’s top story is about Michael Kors buying Versace.
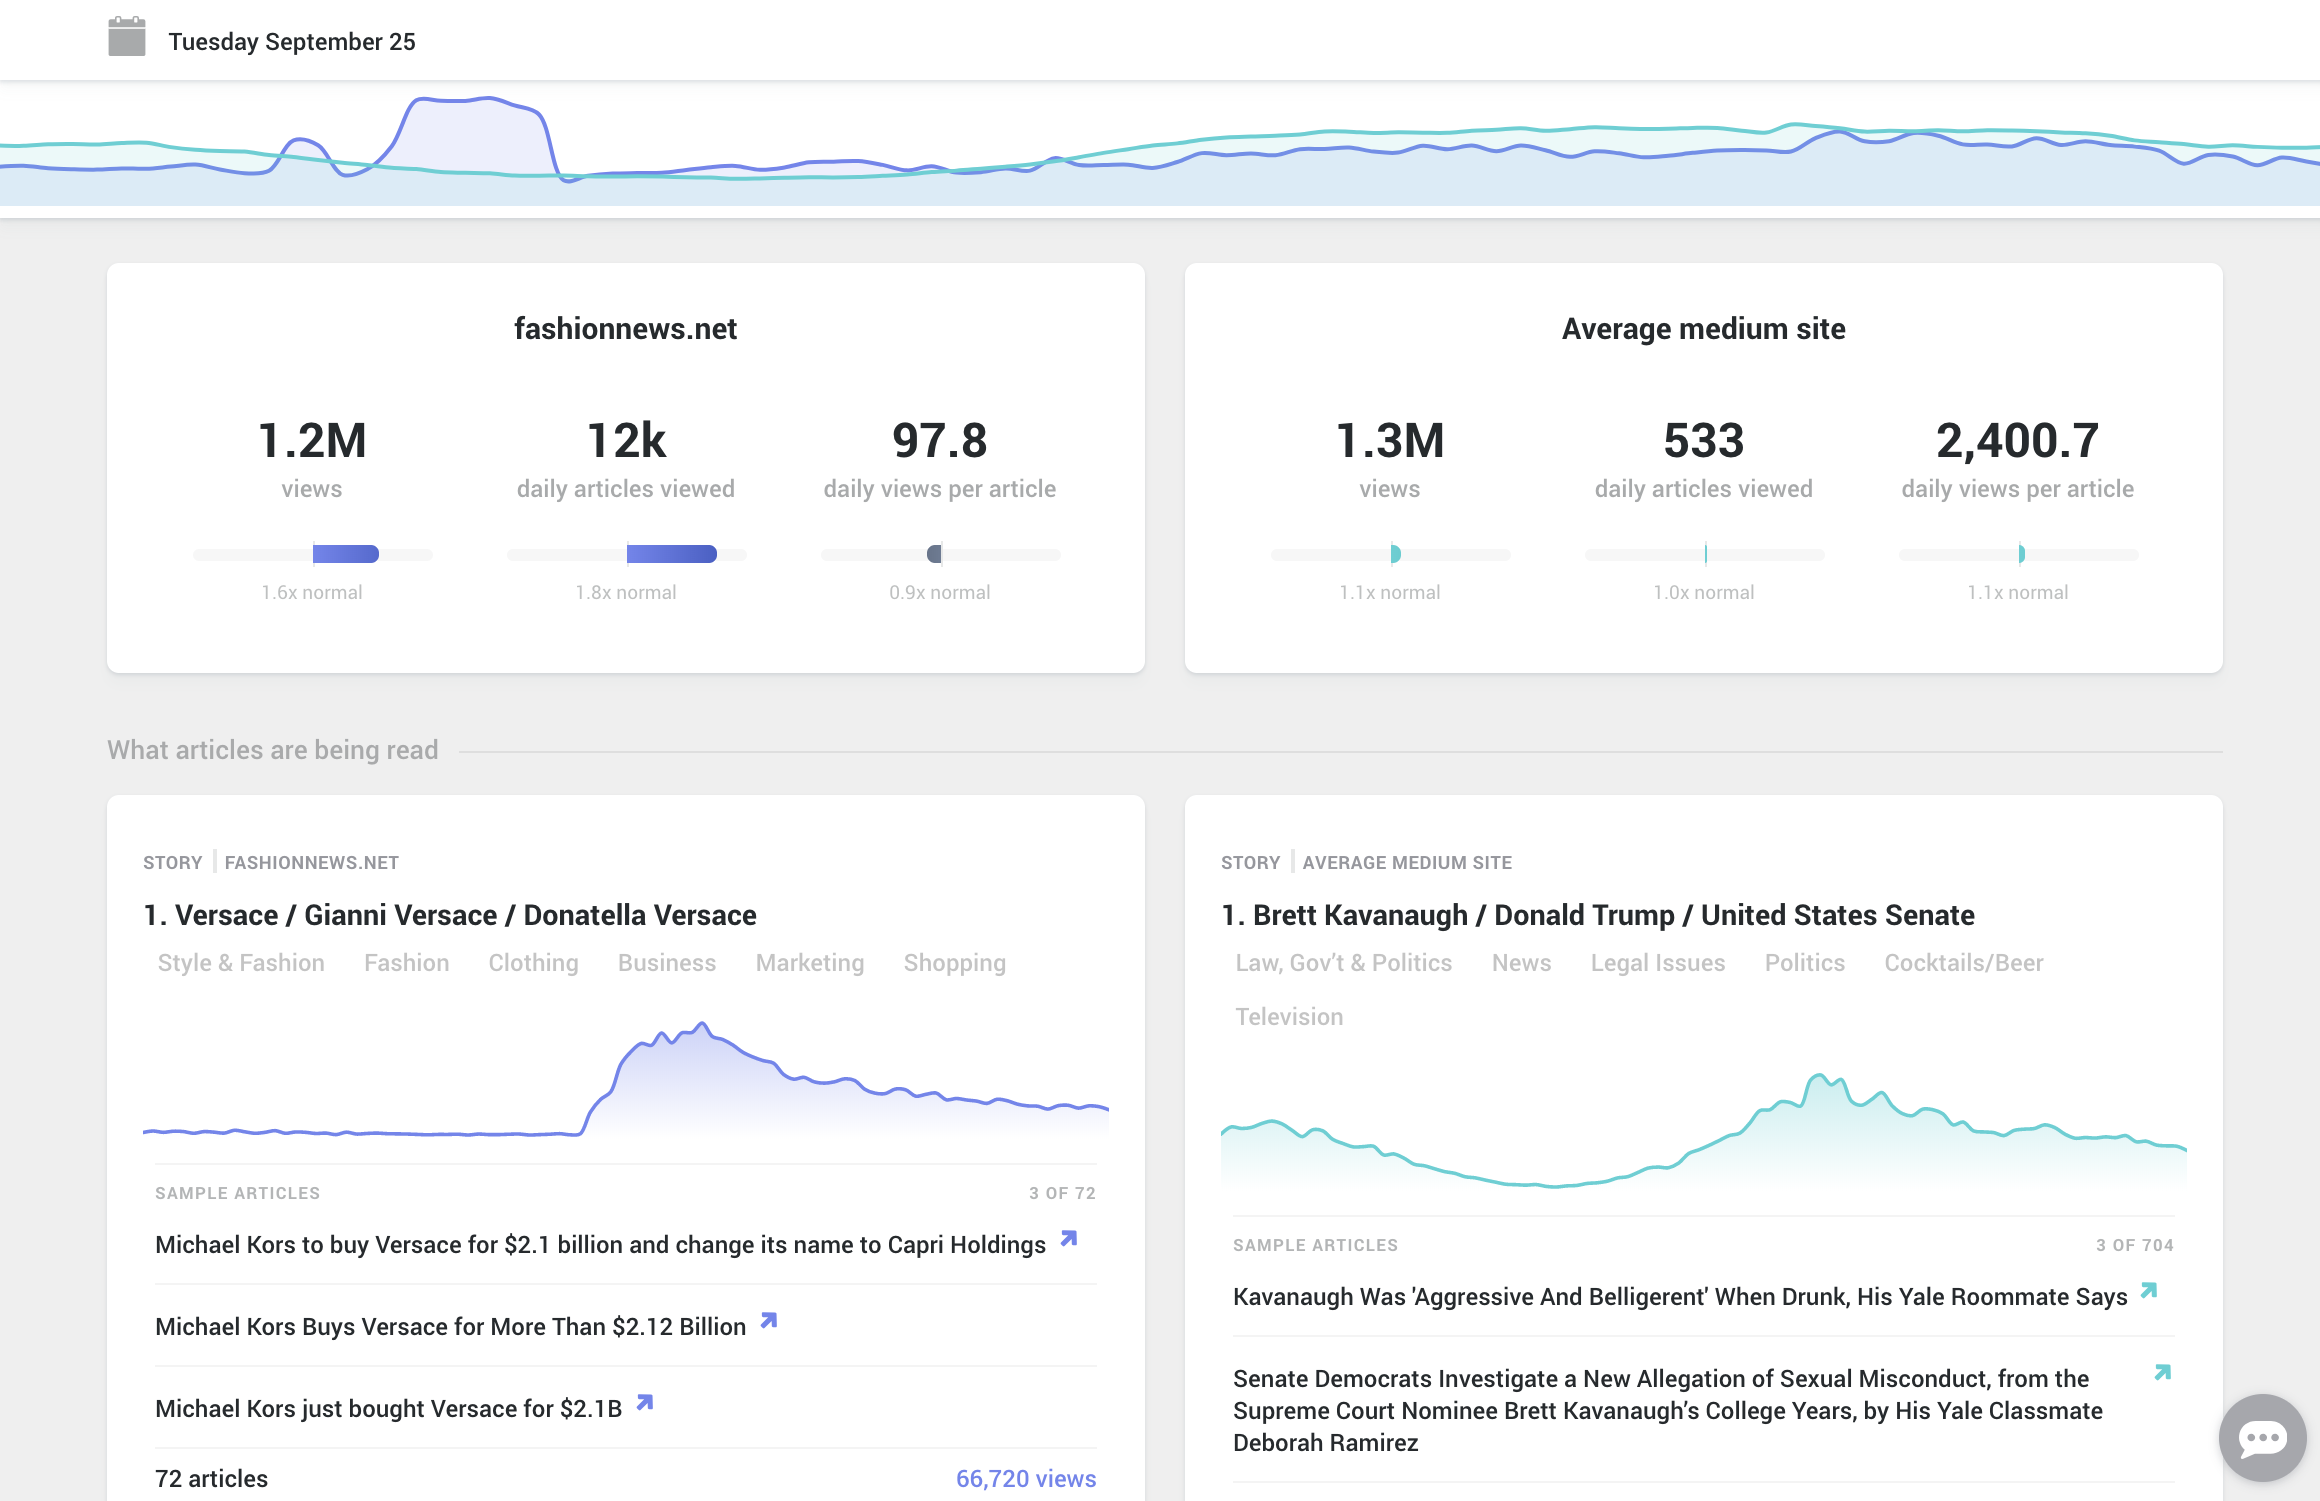
News about this fashion empire changing hands has attracted a lot of attention. Maybe there’s an opportunity to write more about the business side of things?
And more we haven’t thought of yet
We’ve been imagining all the things our users will be able to do with these features, but as usual, your individual expertise leads to some of the most valuable ideas. If you have a way you’d like to use Currents comparison data, let us know at currents@parsely.com or explore the data yourself!
Get started with Currents today
- Parse.ly Analytics users: You can log into Currents using your Parse.ly Analytics credentials. Any sites you can see in Parse.ly Analytics should show up on the Currents homepage.
- Pro or Enterprise users can use complex queries. You can upgrade your plan on the Settings page.
- Completely new to Parse.ly? Sign up for free account to see 7 days of data in Currents.