Hurricanes and wildfires cause spikes in local online attention, but not for global warming
When Recode suspected that hurricanes receive disproportionately more media coverage than wildfires, despite both having a comparable human impact, data showed their suspicion was correct: three times more articles had been written about hurricanes than wildfires.
While media coverage was disproportionate, there are similarities in how people found the information. Hurricanes cause an uptick in search traffic before the event, and wildfires during the event. Most strikingly, hurricanes and wildfires cause an increase in local attention for online content.
We also wanted to see if attention data could give any insights into another commonality between hurricanes and wildfires, one of the root causes of extreme weather: global warming. We visualized attention for hurricanes, wildfires, and global warming using page view data from our network of sites.
The animated maps for hurricanes and wildfires below read almost like doppler radar, with attention patterns emerging on the maps like storm paths. The map for global warming looks much different. We learned that just because people are reading about wildfires, it doesn’t mean they’re paying higher than expected attention to global warming.
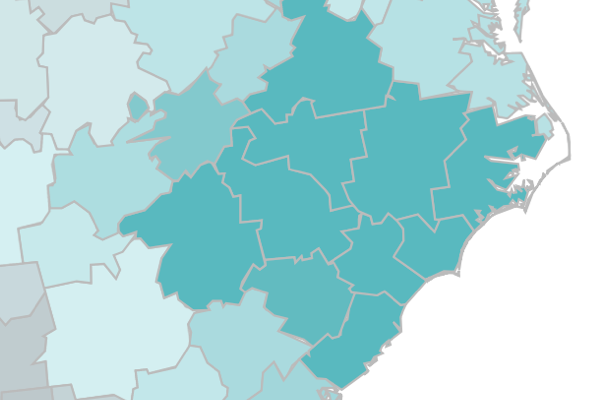
Watch attention for online content about hurricanes concentrate locally in affected areas.
The map below follows readership for the topic “tropical cyclones” over the month of September. Over this time period, three storms of note include:
- Tropical Storm Gordon, which made landfall on the Gulf Coast on September 5th and then moved up the coast.
- Hurricane Florence, a Category 1 storm Hurricane Florence that landfall in North Carolina on September 14th.
- Hurricane Rosa, which made landfall in Mexico and affected the deserts of the American Southwest at the end of September.
On the map below, you can see attention sweep across the country with the storms. Areas that are darkly shaded (in blue) represent regions with a larger share of the national total of page views than usual. Light grey areas represent average interest and dark grey areas show below-average interest.
National attention fades a few days after storms hit, but local attention in the most heavily affected areas persists.
Searches for “wildfires” spiked after the fires started.
Google Trends shows “peak popularity” for the search term “wildfires” on November 10, 2018, days after the Woolsey and Camp fires began on November 8th in California.
On the animated map below, you can see overall attention for wildfires was low until November 8th. Then, search traffic for wildfires increases from 10% to 58% from November 7th to the 8th. For context, the baseline of search traffic for all articles across the network is 30% on November 8th.
However, high search traffic doesn’t last, even when above-average attention for wildfires holds strong in the locally affected areas on the West Coast. On the 19th, search traffic dips under 20%. On the 26th, it dips under 10%.
The patterns of search traffic related to fires are similar to how search traffic jumps as hurricanes are making landfall. Another commonality: geographic attention. Attention for wildfires localizes on the West Coast and in California as the fires begin, similar to the geographic pattern of attention for hurricanes.
What will it take to send above-average attention to articles about global warming? Wildfires don’t seem to be enough.
Studying data about hurricanes and wildfires raised another question: Does increased attention for natural disasters correlate to an increase in attention for global warming?
We looked at attention to the topic of global warming over the same time period as wildfires, November 2018, because this is when the federal government released the climate change report.
In the early stages of analyzing this data, one hypothesis was that the map for global warming might resemble the map for wildfires; maybe attention for global warming would increase in California in early November when the fires started because climate change is a cause of the devastating fires. This hypothesis did not play out. We found no discernible pattern in where people are paying attention to global warming around the time when the wildfires in California began in early November.
While wildfires didn’t seem to impact attention for global warming, the day the Fourth National Climate Assessment was released, editorial referral traffic was over 40% for articles about global warming. Nationwide attention for global warming was more evenly distributed at the end of November than at the beginning and daily page views increased. The release of the federal report, and the press’s efforts to surface the news even though the report was released on Black Friday, seem to have helped spread attention to the topic across the country.
Should reporting on major weather events draw connections to global warming?
Some reporting highlights the connection between extreme weather, climate change, and the impact on our planet, as the Columbia Journalism Review notes. However, this isn’t always the case. Considering the severity of the wildfires in California, CJR argues:
“The Woolsey and Camp fires are not coincidental, one-off monstrosities, but rather significant new evidence of a rapidly changing climate. Sadly, far too much media coverage has failed to draw that link.”
When a major weather event occurs, people are paying above-average attention in the local area of the threat and through search. One way to potentially draw that link? Journalists could consider connecting the dots for people who are already paying attention to weather events through search with this reporting about global warming.
Optimizing articles about natural disasters for search can help surface answers to the pressing questions readers are asking, especially ones about storm severity and safety issues. At the same time, optimizing articles about weather events in the context of climate change could help connect with people who are already searching, demonstrating to those readers across the country the connection between local disasters and a global phenomenon.
Data visualizations created by Tiffany France.