Discover.google.com gone as a referring URL in latest referral traffic trends
Traffic trends in December 2018: Farewell discover.google.com, we hardly knew thee.
We’ll say this for traffic trends at the end of 2018 – they were consistent. In past years, month to month would often show fluctuations in traffic sources that billions of online readers used to find articles or videos on media and content sites.
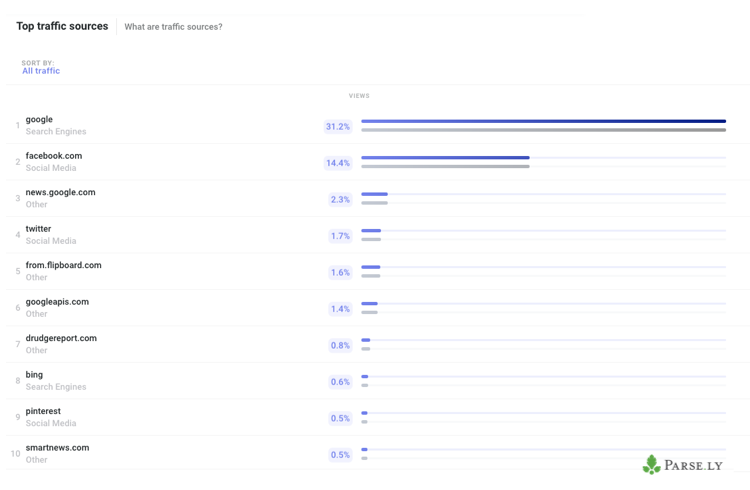
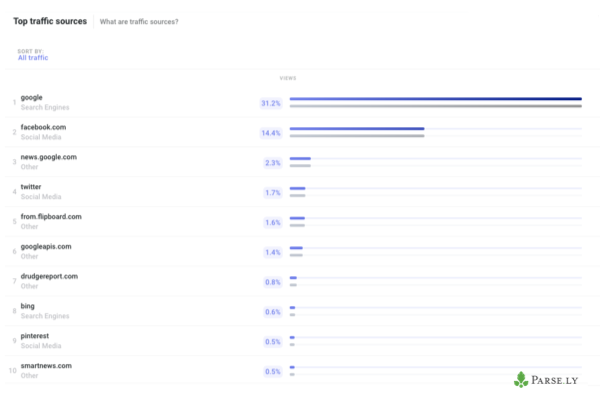
But for the past three months, we’ve seen almost no change to the top ten traffic sources to articles. This past month, December 2018, once again has the top nine referral sources matching October and November’s. At number 10, yahoo.com fell off the list and was replaced by Smartnews (a mobile news aggregator), which had been hovering at the 11th spot.
Top ten external referrers across all traffic to articles in Parse.ly’s English speaking network, December 2018
But what about Google Discover?
Last month we reported that traffic from Google Discover, coming from discover.google.com had taken over the #6 spot from googleapis.com. That referring domain was short-lived it seems, as Googleapis.com has returned to the #6 position. Discover.google.com has completely disappeared, as of Dec. 1.
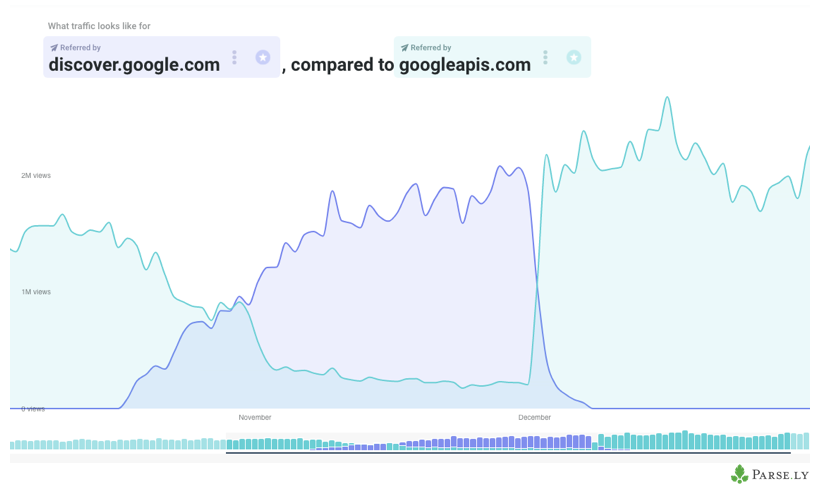
Discover.google.com disappears from our referral traffic after Dec. 1, 2018.
It appears that any traffic from the Google Discover feed comes through as a Googleapis.com referral url now, whereas in November it appeared as discover.google.com. “Articles for you” in Chrome content suggestions also still come in through Googleapis.com. Other Google content recommendation features send referrals through Google Quick Search Box, which, since it also sends search traffic is included more broadly as just Google Search traffic.
We read slightly less about Law, Government, and Politics
Post-midterms (or maybe as a holiday present to ourselves) readers read slightly less about Politics than they had in the previous two months. Most articles saw significantly less traffic per article during December.
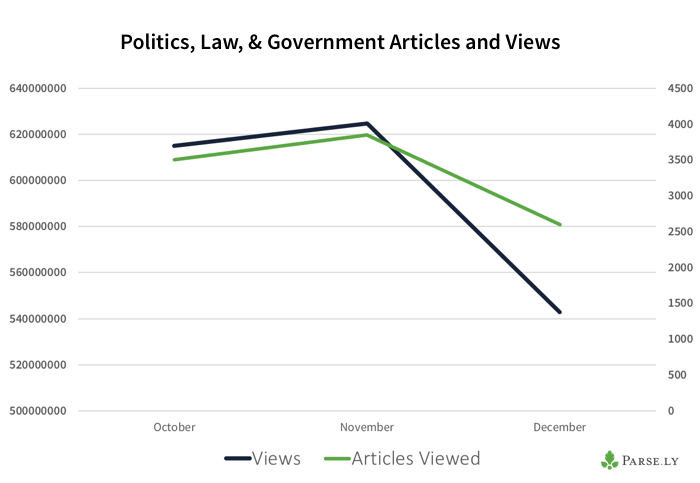
Law, Government, and Politics articles beat the next most viewed category, Health and Fitness, by 3.5x as much traffic. Both had a similar number of articles viewed: 2,600 articles about Politics, 2,400 about Health and Fitness.
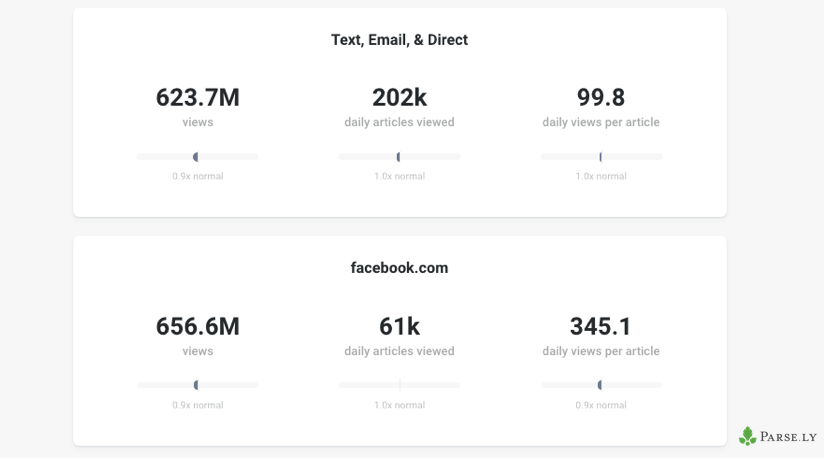
Facebook and Direct traffic are neck and neck in volume
We don’t expect Facebook to go down for long enough to force readers back into a world where they only go directly to their favorite, most trusted apps. However, the hope of destination journalism remains strong given the data we’re seeing.
The amount of people coming from direct sources continues to stay very close to the number coming from Facebook. Last month, 13.6% of traffic came from direct traffic to articles, and 14.4% of traffic came from Facebook. This only includes traffic to article pages; even more direct traffic went to home pages, though that data is not included in this analysis.
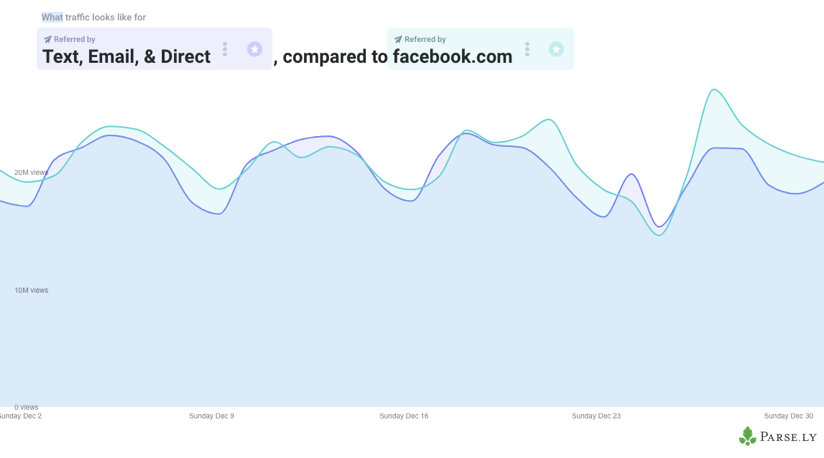
The biggest difference to note between the two sources? Facebook’s traffic is much more concentrated – with less articles viewed and more views per article. Direct traffic varies widely, sending traffic to over 200,000 articles daily compared to 61,000 articles that receive traffic from Facebook.
That’s it for December 2018. Make sure to sign up for our newsletter to get our monthly recap of traffic trends first!