Reader loyalty data shows more sessions per visitor from social, more views per session from search

Building a habit takes time. In the way that these stats live in our collective, though often inaccurate, hive mind, there’s some stat that says it takes 21 days to build a habit. Jeremy Dean, the author of Making Habits, Breaking Habits, shows that depending on the “difficulty” of the habit, it can take much longer. He conducted a study showing habits, on average, take 66 days to create, and up to well over 200.
So, in short, building a habit for yourself is already hard. What if your job is to try to get other people to build a habit? Research and on-the-ground examples increasingly show that building a habit is a big predictor of digital conversion (of any type) when it comes to how to measure content.
We wanted to see what kind of metrics will help most to strategize, map, and motivate your team towards the goals of conversion you want to see. Especially since content discovery tends to be focused on earlier stages of conversion paths. To do that, we looked at a month of our network data from 2018 and evaluated:
- Total visitors
- Visitor frequency: did they return and how often (measured in sessions)
- Visitor depth: how much did they look at when they visited (measured in views and views per session)
- Visitor source: where did they come from per session (measured by referral sources)
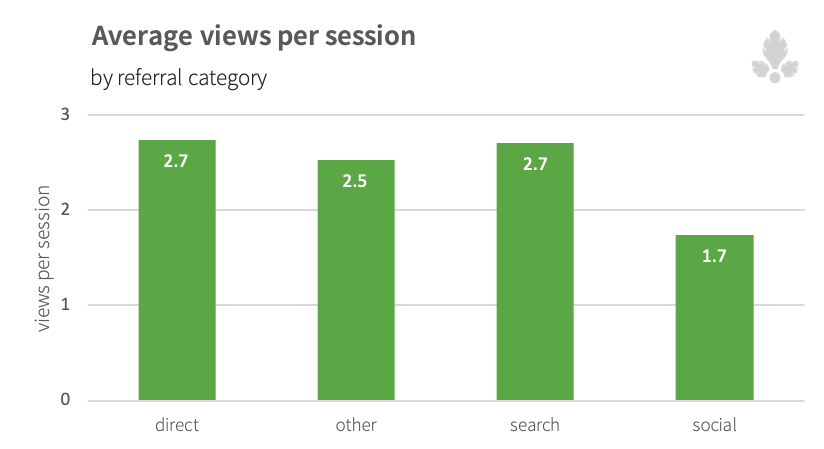
Our data shows that it might not matter how much content someone reads in a single sitting. Even for the most loyal readers of a site, their “attention span,” on average, maxes out at around three page views per session.
It seems you can’t – and may not need to – fight the single page view session (especially in the case of social media, which I’ll get to later). However, the metric that seems to matter the most when it comes to outcomes is converting readers into returning visitors.
In our network, 25-35% of the average site’s traffic, measured in page views, is going to come from readers who are returning to your content.
The amount of returning visitors you have indicates people who are either starting to or have already built a habit with your content. Understanding and growing this audience can have a direct impact on conversion goals.
Here’s the data to get you started thinking about how habits start to get built, and some ideas on how to focus on building more of them if you’re aiming for conversions of any sort.
Reader depth and loyalty patterns in the Parse.ly network
Let’s first set expectations about how much content online audiences look at per visit, across our network:
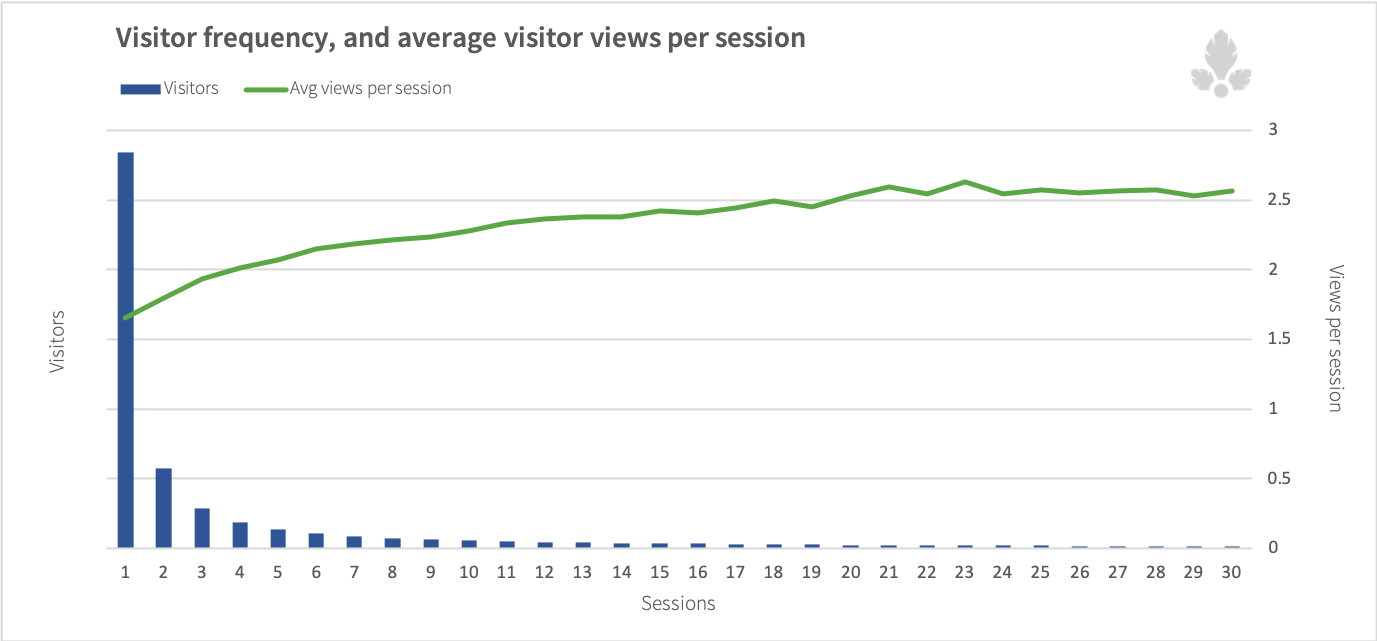
In this sample month from 2018, we looked at how many times a visitor came to a single domain (the X-axis), from one-time visitors to those who come 3x a day. The right-hand Y axis shows the number of views per session. The average site’s distribution of visitors looked like:
- 83% of visitors who visited only once (New visitors)
- 17% of visitors visited more than once (Returning visitors)
The breakdown of visitors who returned to a site:
- 13.7% of visitors visited 2-5 times
- 2.5% of visitors visited 6-15 times
- 1.2% of visitors visited 16 times or more
None of these groups necessarily are more “successful” than others. These number should not be taken for gospel for what your visitor habit distribution should look like.
The danger of aggregating thousands of sites means that averages for stats like this may, or may not, make sense for your audience. For a major news sites with huge volumes of content, 10-12 sessions is a visit every other weekday for a full month. For a smaller site with niche content, a weekly visit on at least a page or two is still a strong habit. In terms of your own metrics, measuring the behavior you want over time matters more than matching any of our aggregate stat or percentage.
But enough disclaimers, look at that Y-axis on the right again, the average number of views per session. While these do increase slightly the more someone returns, and while there are certainly visitors who read more than three pages per session, the average loyal reader’s attention plateaus under three page views per session.
The good news? In a recent study from Medill Local News Initiative at Northwestern, more page views per session negatively correlated with retention among subscribed readers.

The study found that the frequency with which they visited the website had the most positive correlation to retention. While this study focused on local media sites and paid subscriptions, it’s findings could apply to other outcomes. Content programs that struggle with showing attribution could be measured by their ability to create a habit among readers, instead of an immediate conversion.
How channels and platforms influence returning visitors
17% of visitors visit more a domain in our network more than once, in aggregate. Where they found the content, or in marketing-speak, where they started their “user-journey,” impacts how loyal they’re like to be.
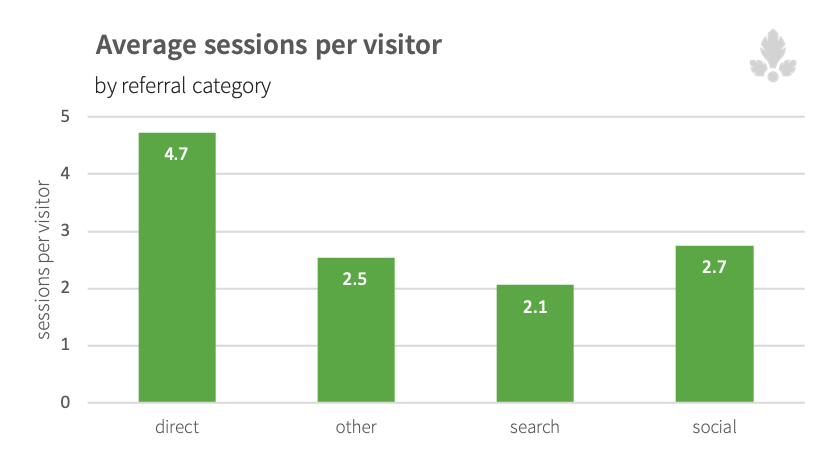
Direct referrals: Your most loyal readers
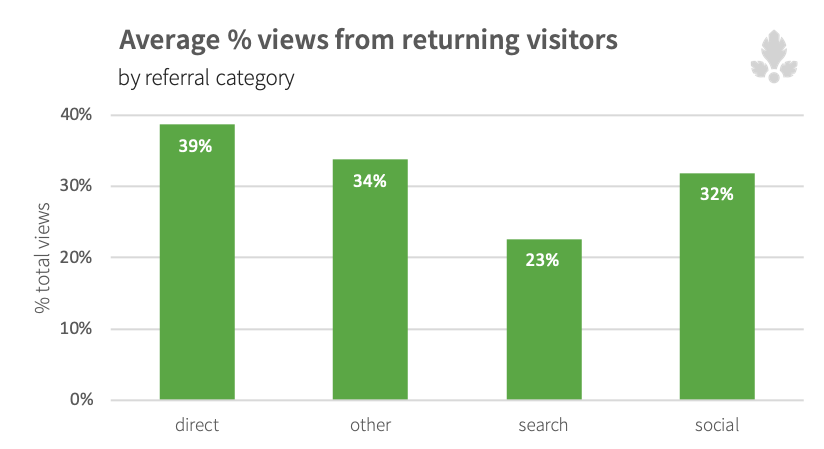
Direct referrals, the visitors who come from email, type in your URL or bookmark your page, as well as those who come from other “dark” traffic sources, are the visitors who have developed the strongest habit of returning to your site. They average almost five sessions per visitor, almost twice any other category. Because they visit so often, returning visitors that come direct also account for the highest percentage of total views.
Score another point for newsletters and home pages. In fact, Wired‘s EIC, Nicholas Thompson wrote in a recap of their first year with a paywall:
[Visitors will] particularly pay, we also learned, if you send them newsletters. The propensity to subscribe by people who enter WIRED.com on a mobile device is rather low—unless they come in via a newsletter. (To give one data point, a visitor who reaches us via search is 1/19th as likely to subscribe as one who comes in from a newsletter; a reader coming in from Facebook is 1/12th; and a reader coming in from Twitter is 1/6th.)
It may seem counter-intuitive, but if you are focused on building an audience that will take some sort of action, increasing the traffic from direct referrals is a good outcome. Make sure to use other tracking methods for the distribution you control, like UTM codes can make sure that you’re not losing out on information about these readers.
Search referrals: Least likely to return
Search referrals send the highest volume of visitors to articles across network. They have for a long time eclipsed social referrals, but when it comes to loyalty over time, search traffic ranks the lowest as a category.
The average visitor coming from search returns to the same site only twice, the least out of any referral category. But don’t let this dissuade you:, per session they do click around more than social visitors do. Search visitors and direct visitors read the same amount, on average, once they get to your site.
This makes a lot of sense, considering that reader’s intent: a visitor referred from search is deliberately seeking information. If SEO is the key for discovery, audience development priorities to increase habit from search traffic could include:
- Showing related content to search visitors
- Borrowing from the cornerstone content technique: create intro-level or summarized content on a specific topic that is key to your brand
- Providing more entry-points for curious readers chock-full of related links (think: “Beginner’s guide to…” or “Best of…” lists)
- Re-target search visitors with sponsored content ads on other platforms to encourage the “habit” behavior of returning to your site
Ultimately, you want to find ways to let your audience build familiarity, even if they come through a high-intent search channel. Returning visitors, then, are a proxy for that familiarity, and can be used to measure that success.
Social referrals: Loyal readers that only read one thing at a time
Social referrals surprised us. The conventional wisdom states that social media visitors are fickle and visit whatever content shown by the almighty algorithm. This notion isn’t completely unfounded: the average social visitor is probably only going to read one article per session. And while certainly Facebook’s algorithm can massively impact the volume of visitors, it seems that those that come from social networks are just as likely to return as visitors who come directly. Readers from social media are more likely to return to your site than search visitors.
And not every social platform is created equal. On average, 25% of visitors from Twitter to sites are returning visitors, while only 5% of visitors from Instagram are returning. Facebook clocks in just under Twitter at 19% of visitors returning to sites more than once.
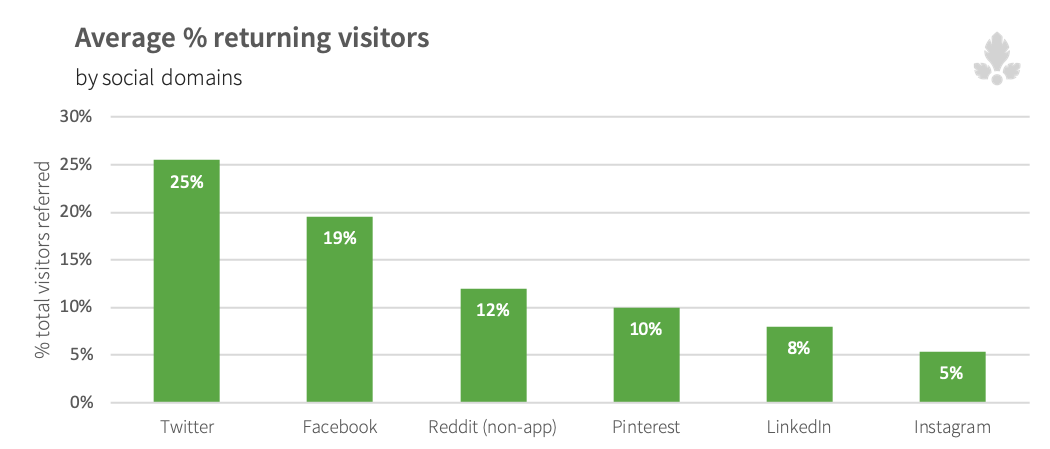
These numbers could reflect the users of the platforms, the quirks of the products, or the efforts of content distribution. Most likely, they represent a combination of all three.
Compare Twitter and Instagram for example. It could be that more energy has been invested in getting followers on Twitter, which results in more returning visitors. Concerted efforts around building a following from Instagram are less tried and true. It could also be that because sharing content on Twitter is simply much easier for users than it is on Instagram, extending familiarity to both the user and the user’s social network.
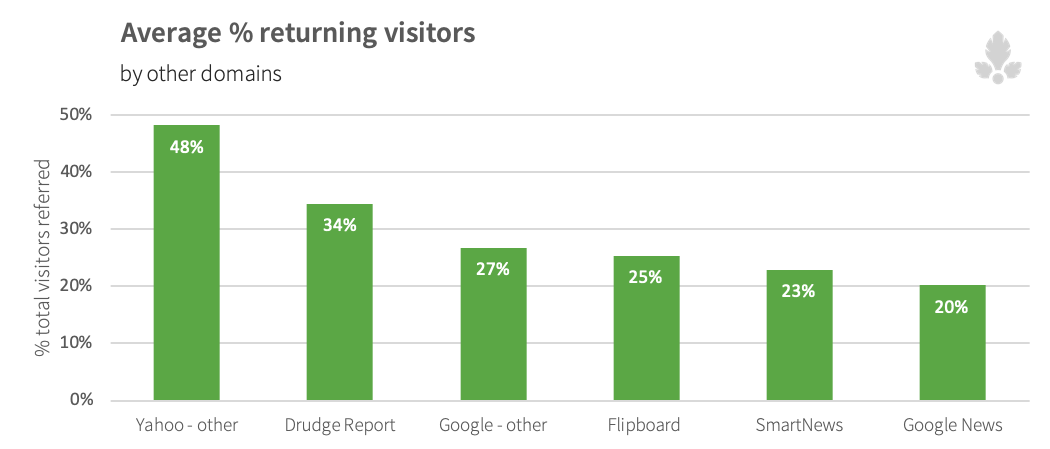
As we recently discovered, the catch-all Other referral category is smaller in terms of volume, but incredibly diverse and growing very quickly. For news aggregators in particular, you might worry the users of these apps are brand agnostic. Fear not – they rank well on returning visitors. Flipboard, SmartNews, and Google News all have over an average of over 20% of returning visitors.
Building reader habits: Your action items
As we’ve looked at this data and talked to people in our Conversions pilot program, it’s clear that there isn’t a single point of conversion that matters most when it comes to content. It’s a series of steps along the way, and measuring each of them is key to the end goal.
One might call it a funnel, which a lot of marketers are familiar with this concept. But with content, the funnel has multiple points of entry, and though you can enter at the beginning, the likelihood increases as you become more and more active as an audience member. Understanding the top line of this graph will help in increasing any goals in the second two.
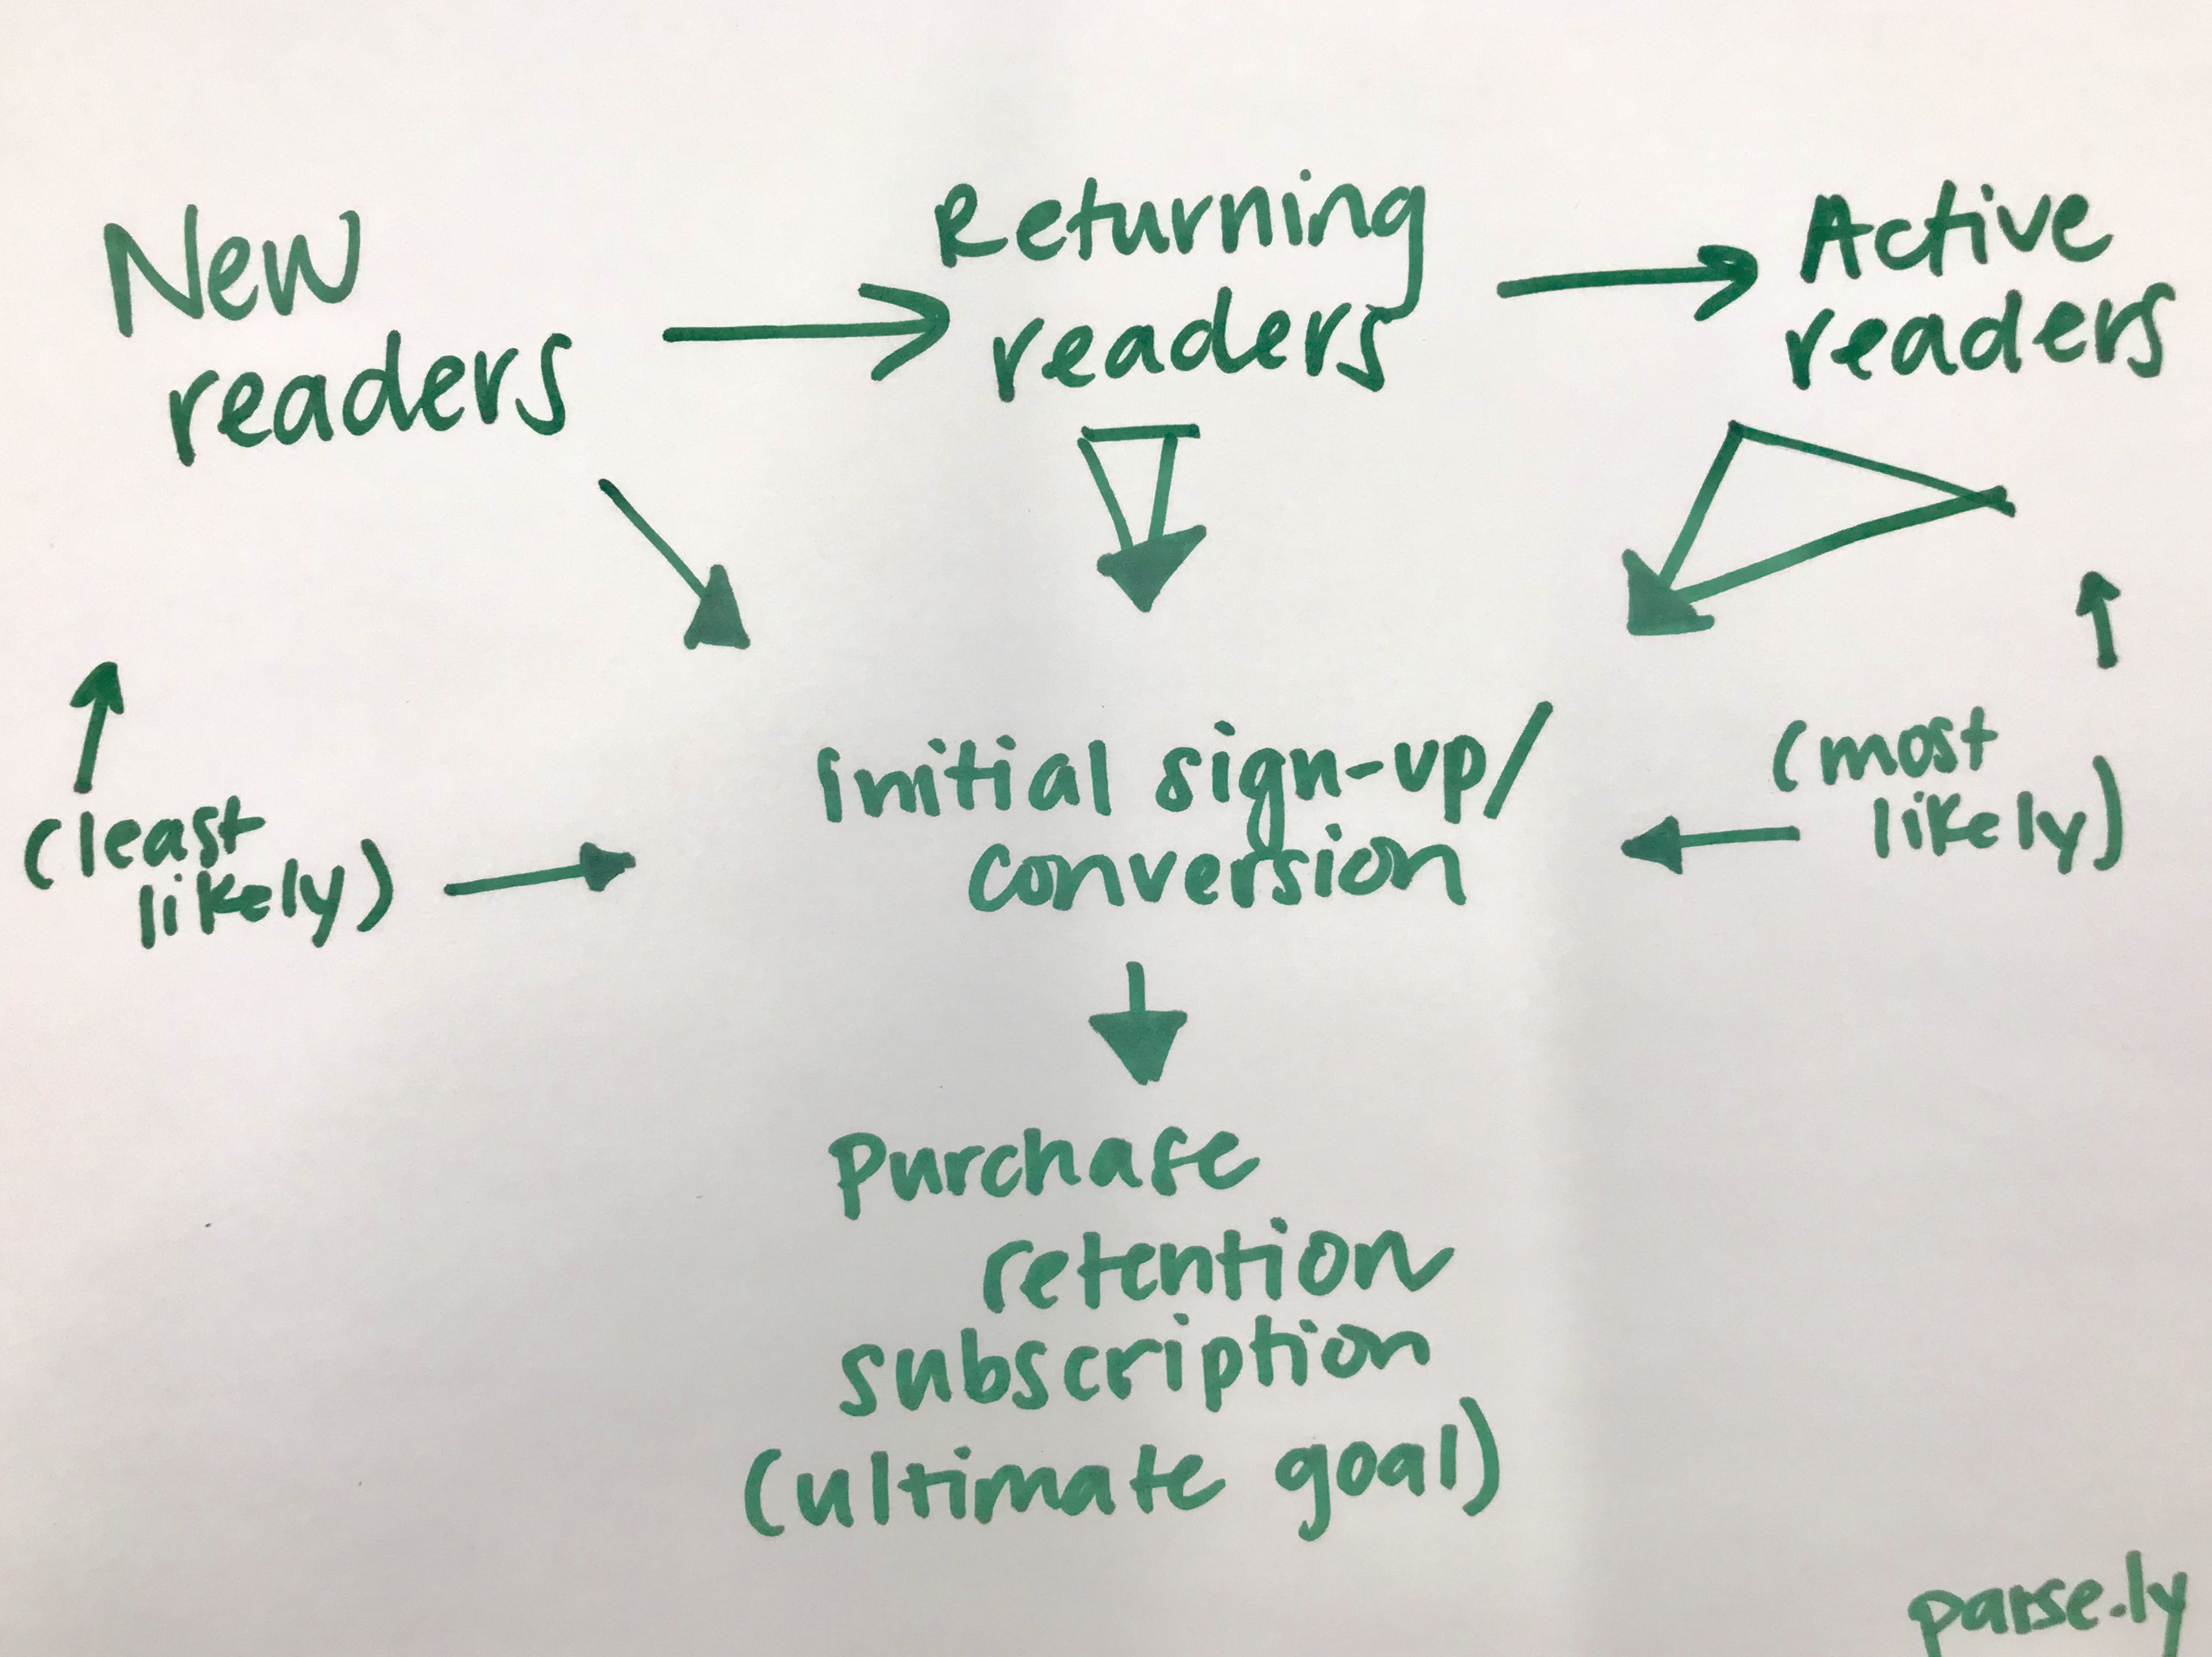
Every journey begins with a single step, right? That’s true for your users, and for your measurement program. For those just getting started, set goals and focus on the behavior of returning visitors as a distinct segment. This will allow you to start to see how this group of your readers differs from newly acquired ones.
For companies and teams ready to take the next steps, set up a small group to examine the audience patterns. Connecting these patters to conversions can help create recommendations or a starting discussion point for reaching that ultimate outcome. Parse.ly clients can use our data pipeline for analysis like this.