The demand for cross-sectional content: Using NLP to find niche audiences

Striking a balance between content that’s too-general and too-niche is a struggle many content creators face. In my world, that content is about the trends we see across the Parse.ly network, where and how readers find what they need. How can I communicate the most unique, relevant attention patterns without stating the obvious?
In this case, a pattern emerged through post-it notes.
I can’t tell you how many post-it notes have littered my desk. And post-it notes are not typically how I like to begin a data study. They are simply reminders to look into small anomalies, or random details that got edited out of a final draft. But those details piled up, and I noticed that all the idiosyncracies I stuck on my monitors were precisely what people ask me about all the time:
What makes my audience unique?
My favorite post-it came from when we studied top referral sources by device type, word count, and category. At the time, the top categories on Instagram were “Style & Fashion” and “Health & Fitness.” That was not surprising. But what if I told you that the top related categories in “Style & Fashion” were “Tech” and “Sexuality”? Or that the top related category to “Health & Fitness” was “Psychology/Psychiatry”? That paints a very different picture of Instagram’s audience.
I wondered how much content categorized as Style & Fashion was more specifically about smart-fit sneakers, or LGBTQ representation? How much of Health & Fitness was actually about mental health? That post-it note never left my desk.
Because understanding these nuances is the key to creating content that stands out.
Language processing, naturally
Before we dive too deep, it’s important to understand how this kind of categorization works. Parse.ly uses natural language processing (NLP) to group content into a hierarchy of categories, sub-categories, topics, and even topic clusters, that we call “stories.” Using an algorithm to parse the semantic relationships between words (aka word vectors), our co-founder Andrew Montalenti explains:
“We can tell that of the thousands of stories written about Elon Musk, some percentage are written about Elon Musk + Tesla, and some other percentage about Elon Musk + SpaceX. We can also start to learn that articles about Tesla tend to be “Business” articles, and articles about SpaceX tend to be “Science” articles. […] Our NLP engine learns the relationships (or non-relationships) among articles in a way that models human understanding of information and content quite accurately.”
Naturally, a single post can be about several things, each weighted for accuracy on a scale from 0 to 1, 1 being most relevant. For now, let’s only consider a category “relevant” if it has a score of at least 0.3.
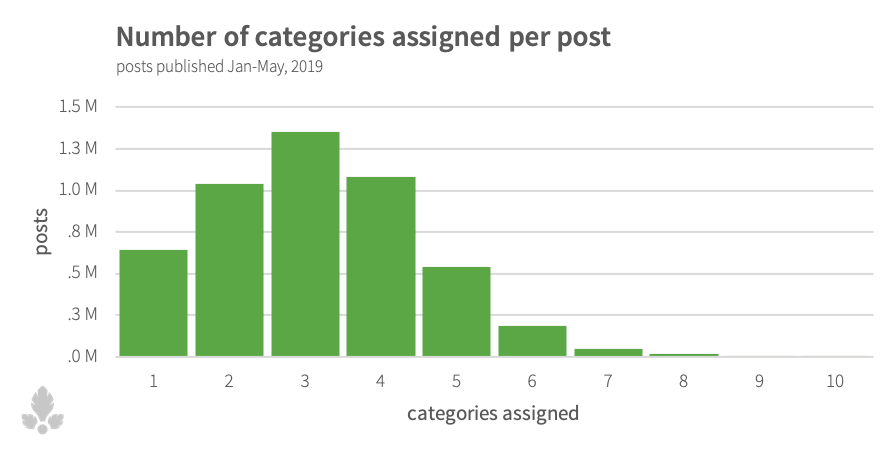
I analyzed just shy of 5 million urls from January through May 2019, across 360 IAB categories and discovered:
- Only 13% of content falls squarely into one category
- 5% is about six or more categories
- Most content falls into 3 unique categories
That means a post primarily about, say, “Business” could just as likely appear in the “Science” category or “Technology & Computing,” or both.
So what can these cross-sections tell us about the content that really matters?
At the intersection of interest
Let’s assume that on any given post, the category with the highest score is the “primary” category, which makes the others “secondary.” From there, we can study the intersections, or co-occurrences, of primary and secondary categories by interest and demand. (That is, by views and the ratio of views per post.) Let’s start with the top 20 most-viewed categories of 2019. Where are the intersections of interest in our top content? And is that intersection with other top content, or something more niche?
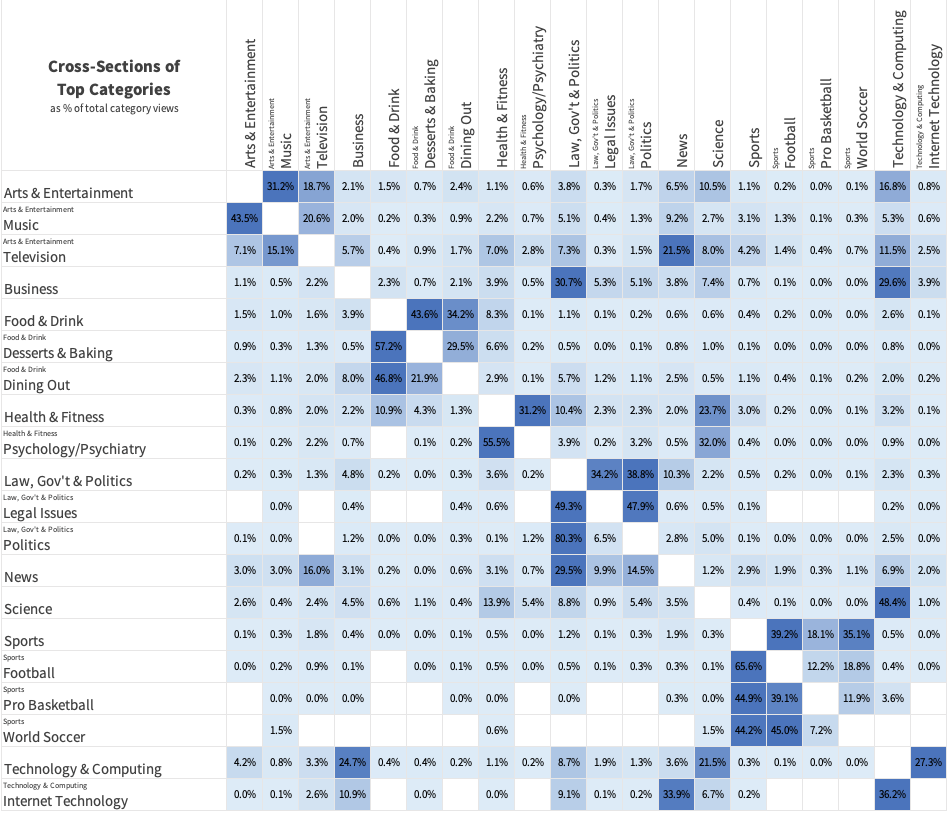
Clusters of color indicate high interest in related content, like the cross-section of “Food & Drink” and “Dining Out.” But the peppering beyond those clusters indicates high interest to more diverse cross-sections. This is where we see content about “Television” performs best when it’s crossed with “Music,” “News,” and “Technology & Computing.”
“Sports,” for example, is one of the most specific categories, relating mostly to other top sports content. “Food & Drink” also intersects less often.
Comparatively, traffic to “News,” is highly cross-sectional, spanning across most other top categories, though “Law, Gov’t & Politics” and “Television” stand out.
While much of this underscores the obvious, the extent of cross-sections (or specificity) might be surprising. In fact, some top categories don’t intersect with other content at all. Of the top 20 categories, “Legal Issues” and “World Soccer” have the fewest intersections with other top categories. “Legal Issues” has comparatively little traffic, if any, coming from any other category but “Law, Gov’t & Politics.”
The demand for cross-sectional content
But these categories are the real gems, as they are among the most multi-faceted, cross-sectional content:
- Technology & Computing
- Health & Fitness
- Business
- Science
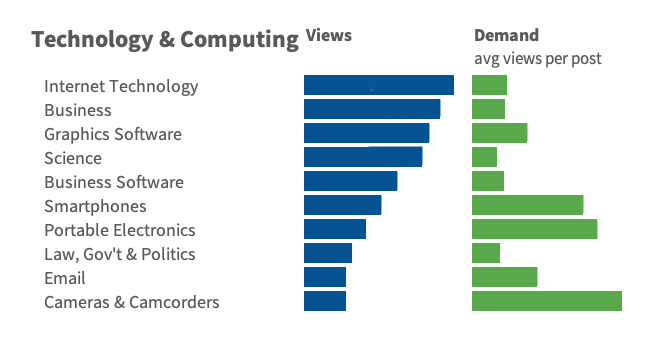
“Tech & Computing” intersects heavily with “Business,” “Science,” and “Law, Gov’t & Politics.” “Internet Technology” and “Graphic Software” are the first- and third-highest cross-sections by interest, with “Graphics Software” in high demand, perhaps illustrating the need to visually wrap our brains around the deluge of data in our day-to-day. There is also particularly high demand within Tech & Computing for gadgetry.
Still, it seems the largest interest in content about Tech & Computing is within the industries that require it the most.
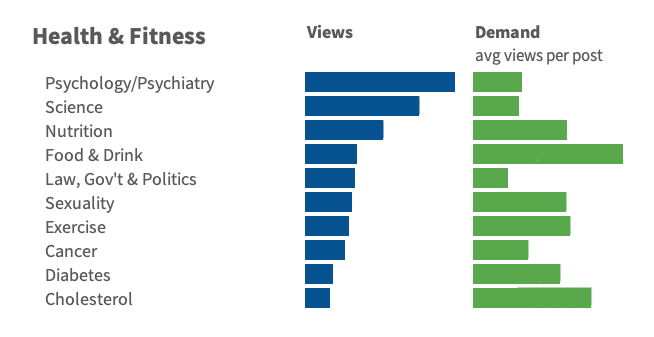
Health & Fitness intersects highly with other top categories, “Psychology/Psychiatry” and “Science.” “Food & Drink” is in particularly high demand when it comes to health content. In a way, this is much like “Technology & Computing”: cross-sections with high interest may illustrate a desire to understand the powers that influence our health, where cross-sections high in demand highlight our need for the tangible control (or lack thereof) we have over it. Behind mental health and nutrition, the highest health-related category is “Sexuality.”
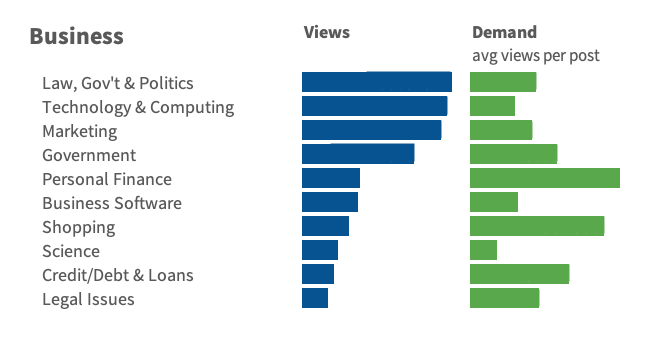
No cross-sections fascinated me more than those within “Business.” “Business” is the 5th highest category across our network, and much content in this category is also largely about “Law, Gov’t & Politics” or “Technology & Computing,” which rank #1 and #3, respectively. The co-occurrence of these top-performers illustrates how closely linked these three domains have become; high pageviews to them all show our audience’s high level of interest in these areas.
But even this is nuanced, as “Marketing” and “Government” rank nearly as high. Sweeping legislative change (or lack thereof) regarding personal data and advertising continue to hold readers’ attention in “Business” coverage.
The “Business” category fascinates me because it is both sweeping and specific, both public and personal. High demand in “Personal Finance,” “Shopping,” and “Credit/Debt & Loans” suggests mass appeal for how and where individual readers spend their dollars and time.
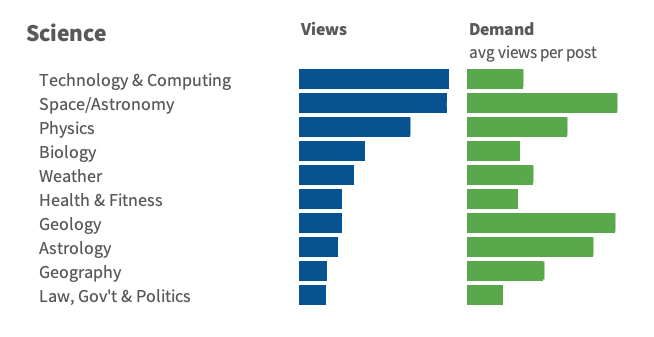
Three major cross-sections in “Science” include “Technology & Computing,” “Health & Fitness,” and “Law, Gov’t & Politics.” As much as these categories intersect, it would not surprise me if in 10 years, the IAB updated the categories to merge “Science” and “Technology & Computing” into a single category. Yet each is diverse within itself.
The top two cross-sections in science-related fields include “Space/Astronomy” and “Physics.” In fact, science content about “Space/Astronomy” is also some of the highest in-demand content in this entire study. An optimist may suggest that dreams of becoming astronauts, or at least aspirations to hang with the likes of Elon Musk, is what captures our attention. But with “Law, Gov’t & Politics” present among science cross-sections, a pessimist may wonder if this pattern is stoked by world powers centralizing military space functions. See for yourself.
High demand for “Weather” and “Geology” within science coverage remind me of how Grist covers climate change or our study on the imbalance of disaster coverage.
Holding the mirror up to nature
Language is messy. Humans are messy. But we’re trying to make sense of it all.
Much like prescriptive linguistics, applying broad categories to “standardize” swaths of diverse, rich content can limit our understanding of where we have a unique audience. Our data, indeed our attention, is as weird and messy and interesting as we are.
If we only recognize “Law, Gov’t & Politics” as the most-viewed category–and it is, by far, the most viewed–then content creators end up in the same tired cycle of chasing big pageview numbers and flashy headlines.
Even within the top 20 categories in our network, audiences demand specific, relatable content–not the barrage of “the usual.” This bodes well for anyone covering the cross-sections of these categories.
I’ll be spending a lot of time in the near future studying niche audiences. I want to know which cross-sectional categories are loosely related or hotly relevant. I want to know the main channels for generalized content, or which platforms cultivate extraordinarily unique audiences.
Which would you like to hear about most? Write to me: kelsey@parsely.com.