Weekly and monthly trends—a GPS for your content strategy

Balancing the importance of historical trends while remaining present for what’s happening in real-time is something every great content strategist knows how to do.
If real-time analytics are the speedometer in a car, letting you know what’s happening right now so you can adapt on the fly, then historical analytics are the GPS—they can tell you where you need to go.
To make it easier for you to chart a course for your content, we’re embarking on a journey of our own. We’re adding more ways to benchmark historical progress in Parse.ly. Read on to learn more, or click the links below to jump to a section.
Track your month or week so far on Overview
Identify weekly and monthly trends
Benchmark every dimension of your content by month or quarter
Track your week or month so far on Overview
The Overview page is your homebase. One of the most-visited pages in the dashboard, it showcases the success of your content for everyone to see. When we decided to explore week-over-week and month-over-month trends, it was the first place we started.
Many organizations can’t afford to be distracted or constantly reactive. With a renewed focus on engagement, loyalty, and converting audiences, it’s more important to evaluate metrics over a longer period of time. In addition to seeing that you’re having a “business as usual” day, you can now easily see performance for the month or week so far. And since it’s right on the Overview page, your long-term success is there for everyone to see.

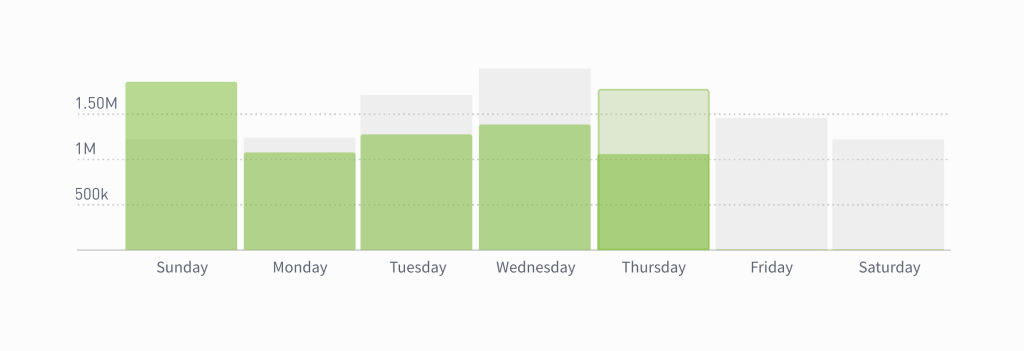
Compare last month to this month by clicking the caret. The gray bars in the graph show the rolling average traffic for the last eight similar days.
To change the time period on Overview, click the cog and select This Week or This Month.
Identify weekly and monthly trends
One of the most common pieces of feedback we hear from customers is: please make it easier to track performance across weeks and months. We listened!
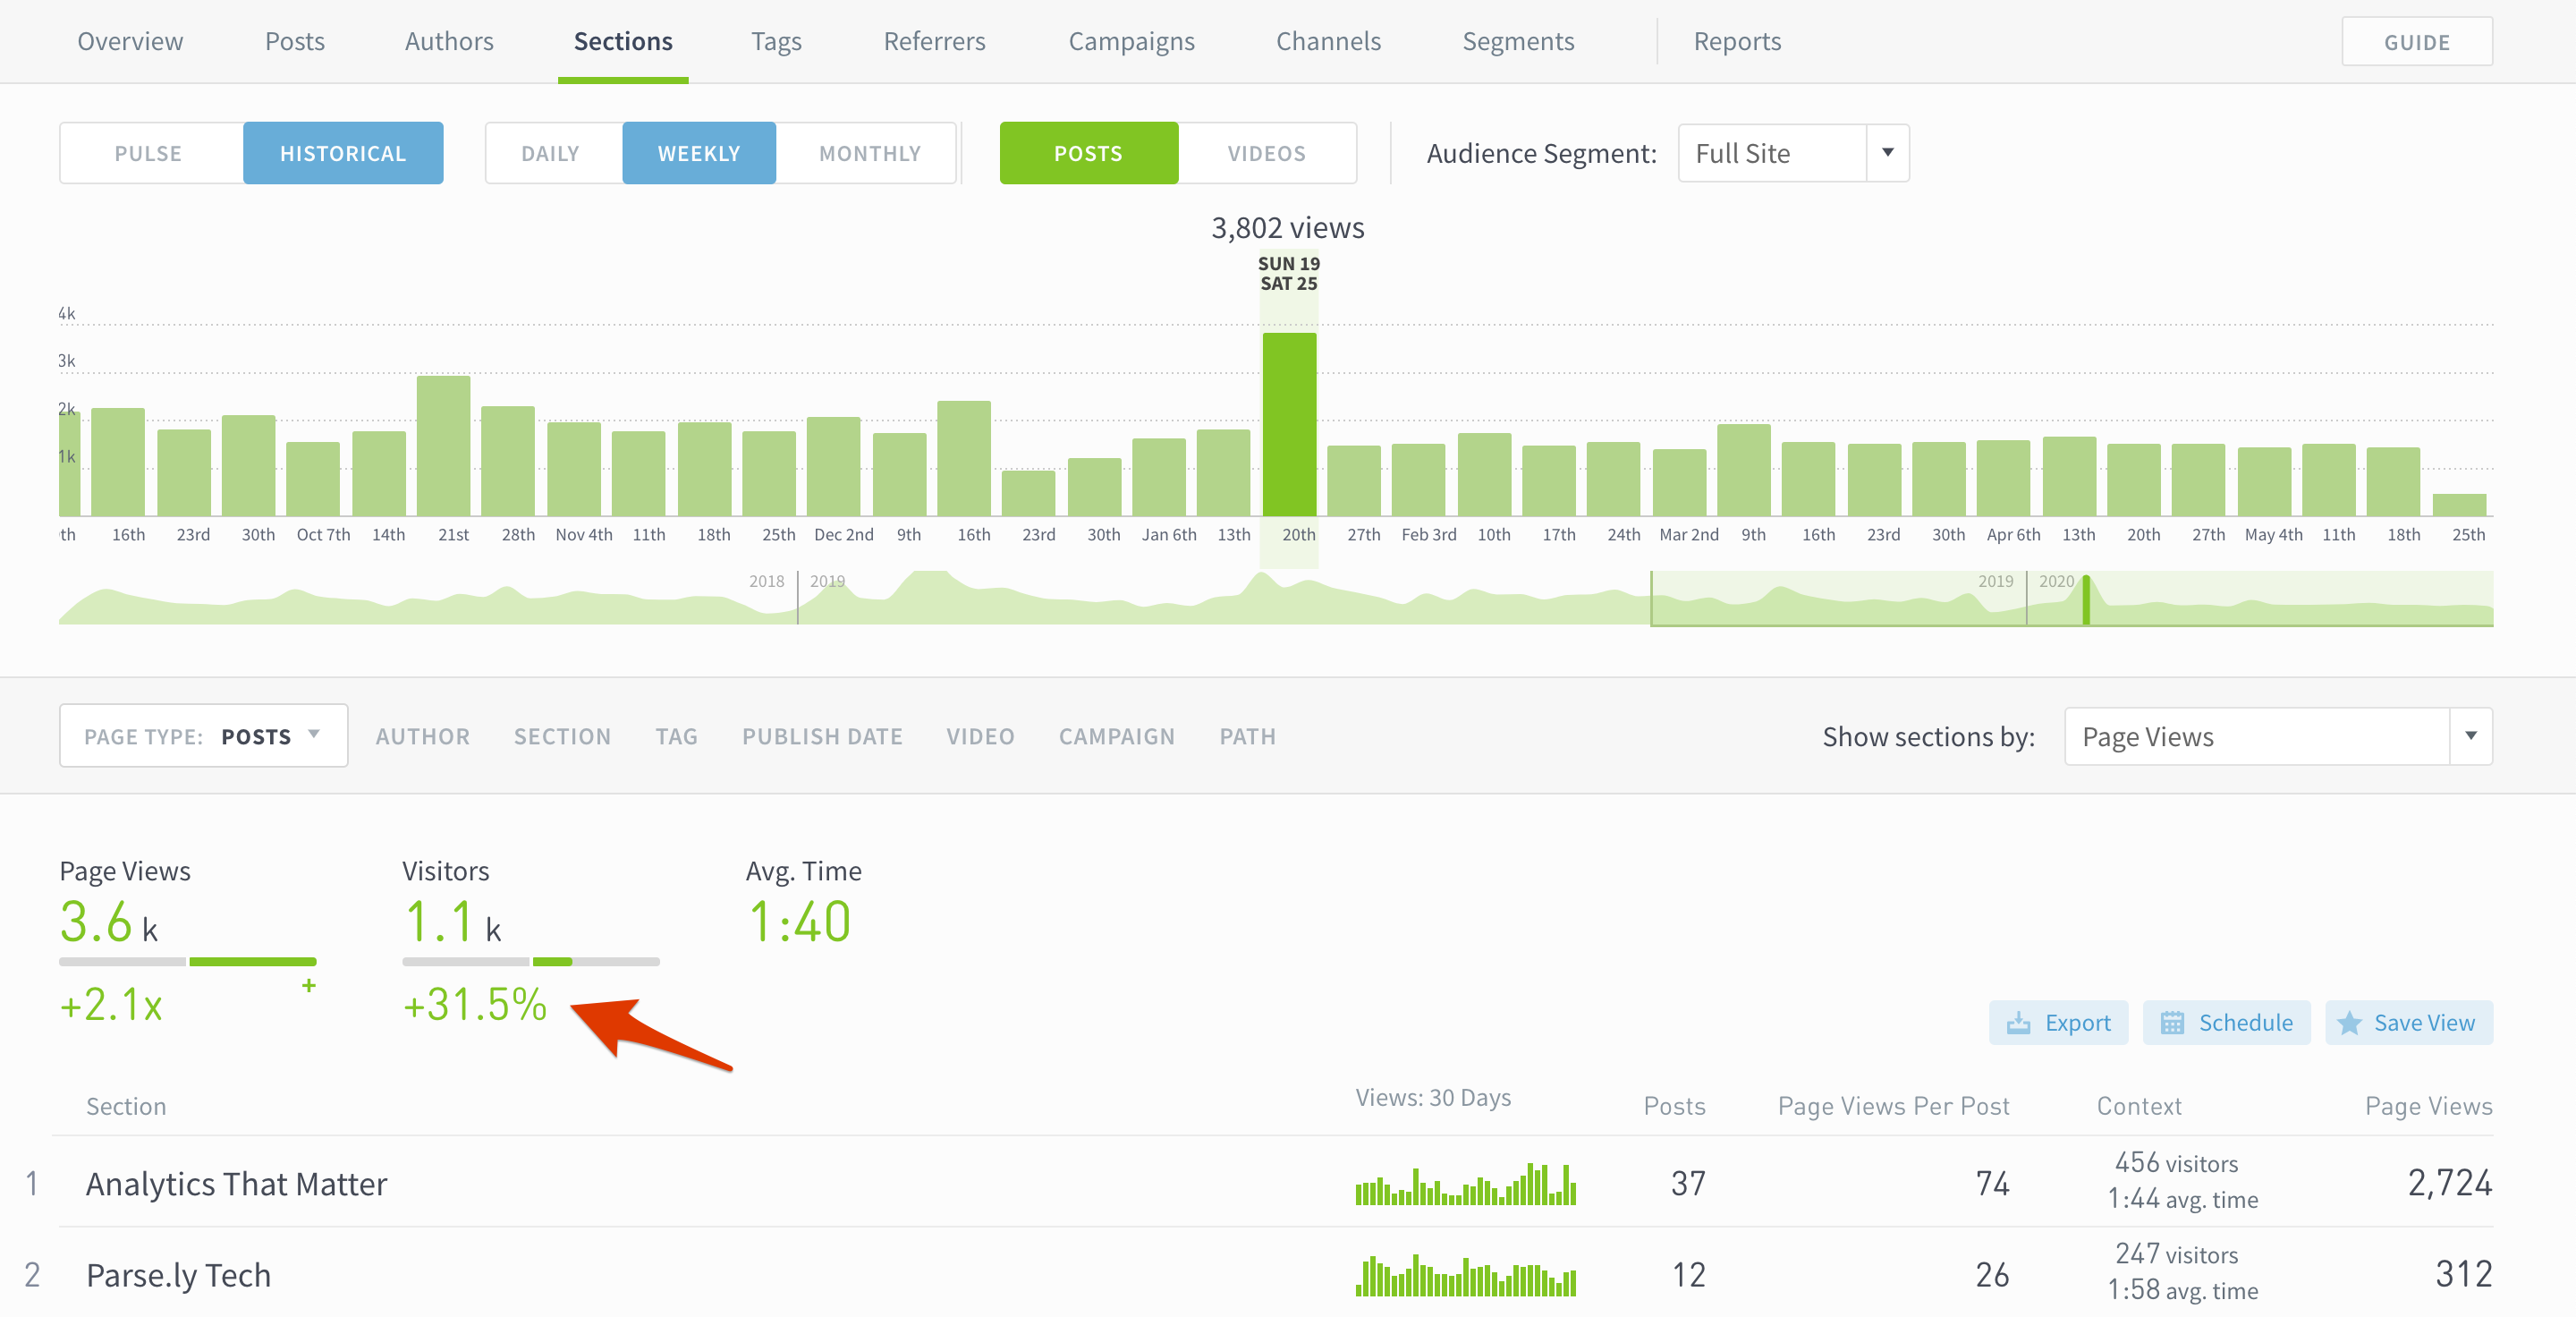
Navigate over to a listing page or details page and click Historical. Select Weekly or Monthly:
This should make it easier to spot trends in the data. If April was a stand-out month for you, what brought in so much traffic? You just need to click into that month to begin investigating.
When you select a week or month, you’ll see the increase or decrease in traffic compared to previous periods.
Benchmark every dimension of your content by month or quarter
Finally, head over to a Benchmarks page. Here you can dig into an author’s, section’s, or tag’s performance by comparing a variety of metrics.
Click “Compare time-over-time instead” to see a monthly or quarterly breakdown of posts published, engaged time, social referrers, and more.
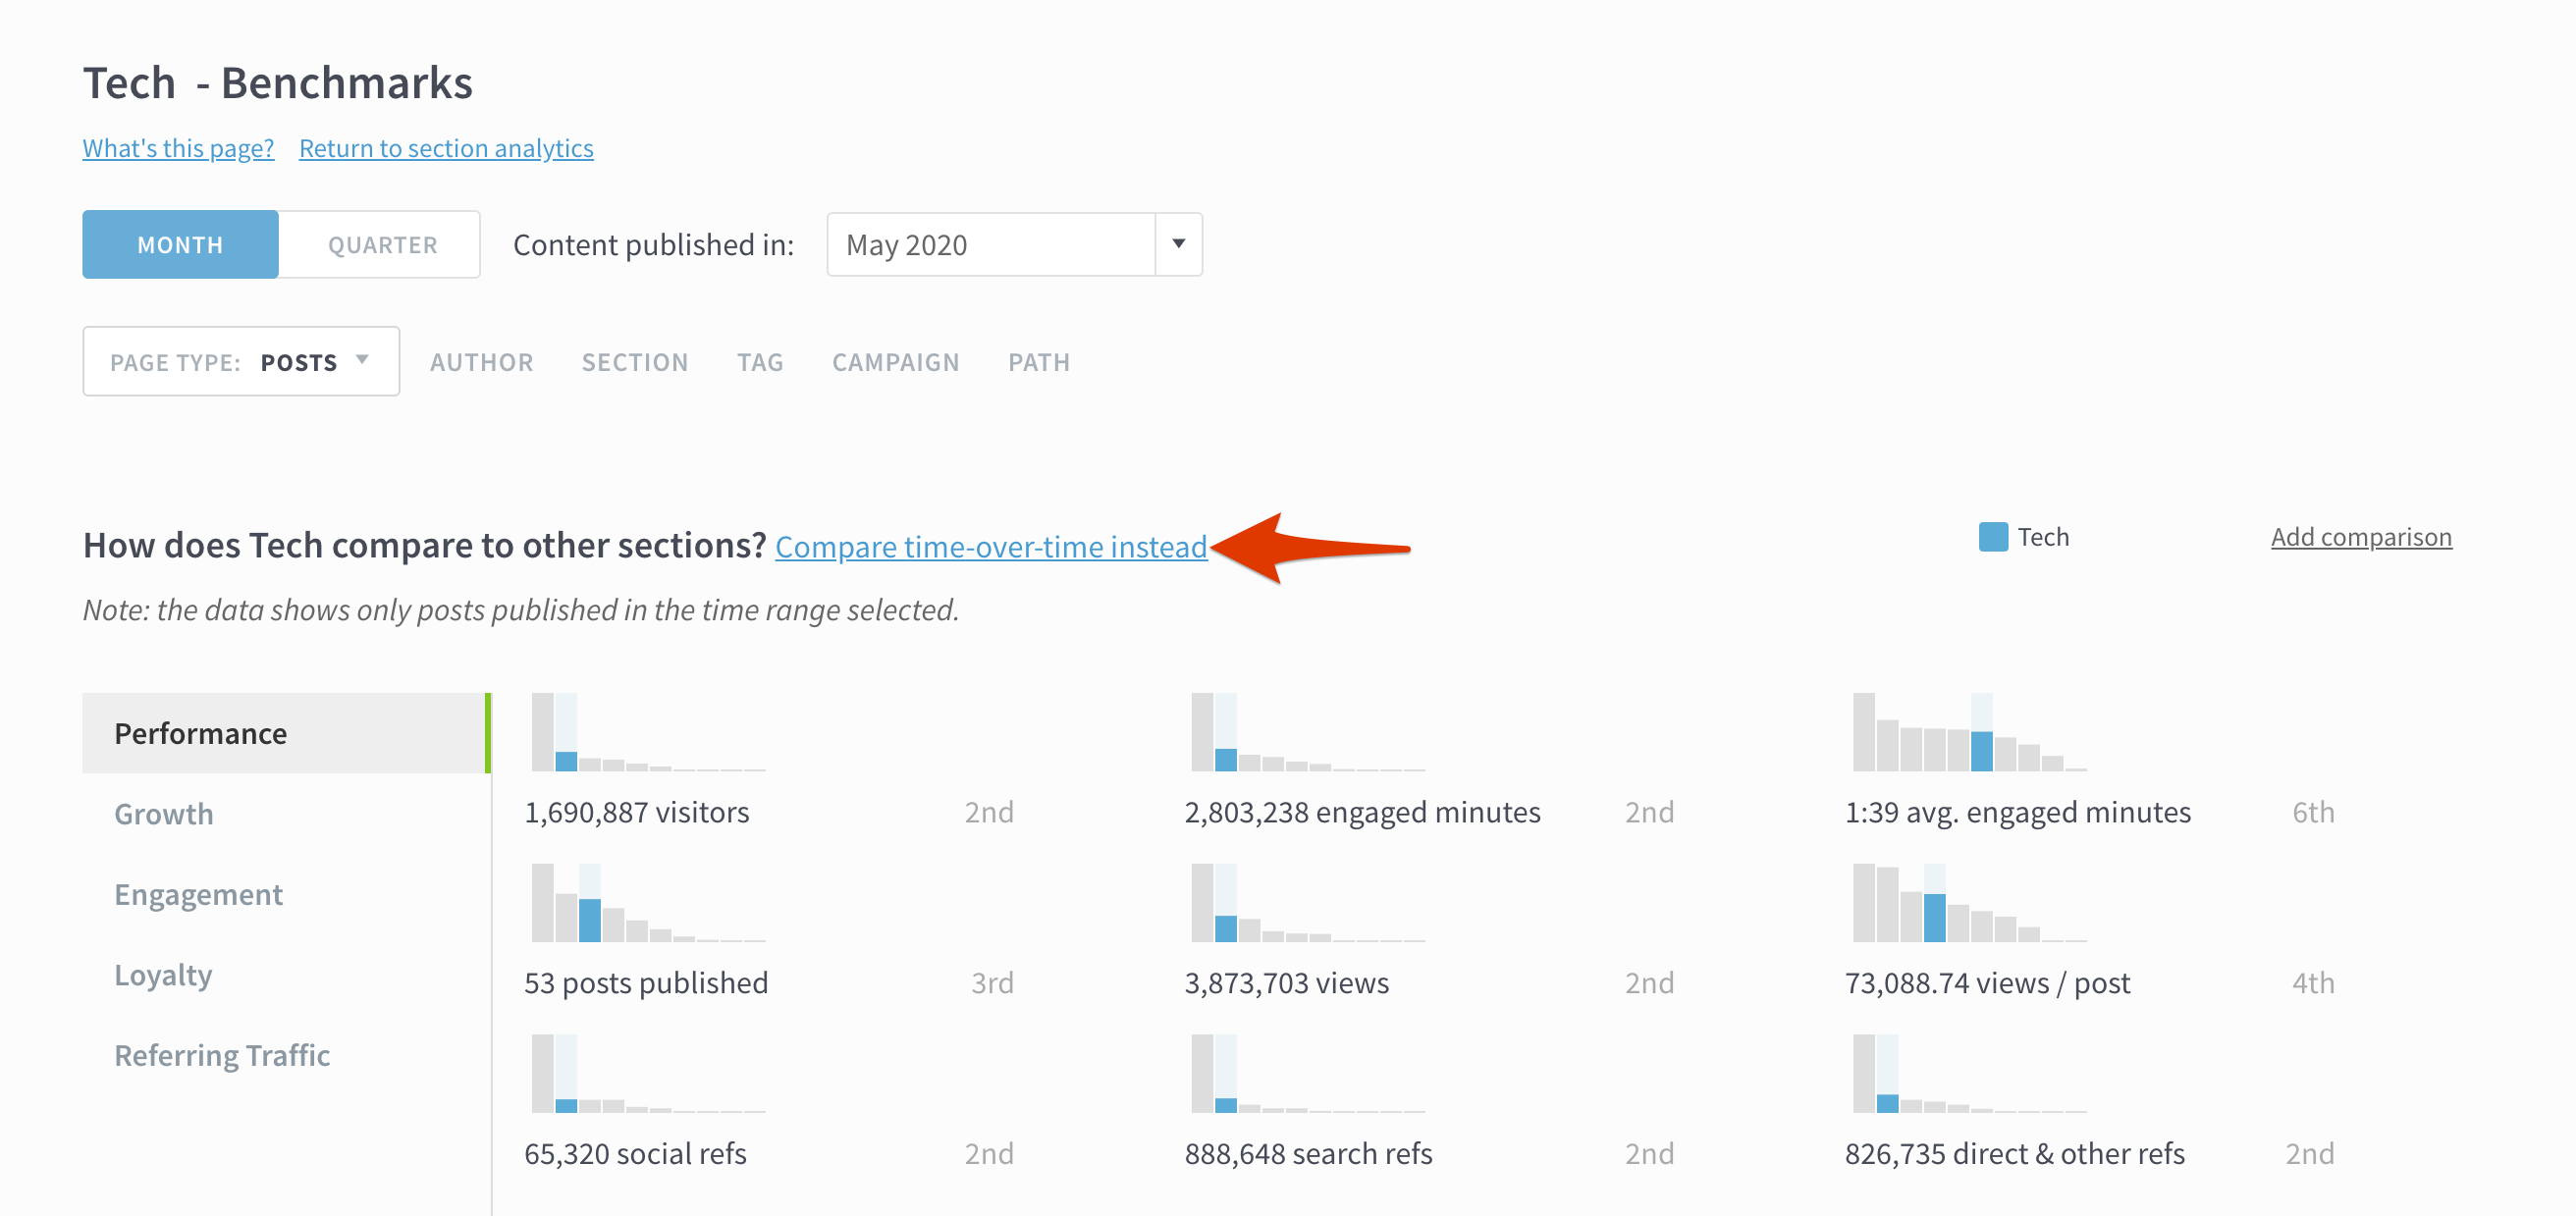
Click “Add comparison” to stack up your success against other time periods. To quickly pick out your biggest wins, sort the graphs by performance, instead of chronologically.
Tell us what you think
These improvements happened because of your feedback. Let us know how we’re doing with a thumbs up or down and leave a comment.