Introducing Recirculation Rate: Keeping Readers On Your Site & Engaging With Content
Today, we are thrilled to announce the release of a new feature: Recirculation Rate. This feature will help you understand which content keeps readers on your site, engaging with more content. For a more technical walk-through of this new feature, check out the Knowledge Base Article.
In this blog, we’ll explain:
- What is Recirculation Rate?
- Why is Recirculation Rate important?
- Example decisions you could make with Recirculation Rate
What is Recirculation Rate?
If a post has 100 page views, and 45 of those page views lead to the user clicking on another piece of content on your site, it has a 45% recirculation rate.
Recirculation Rate is a new metric at Parse.ly that lets you rank which content on your site refers the most traffic to other content on your site, keeping readers engaged with you—instead of closing the tab and heading elsewhere.
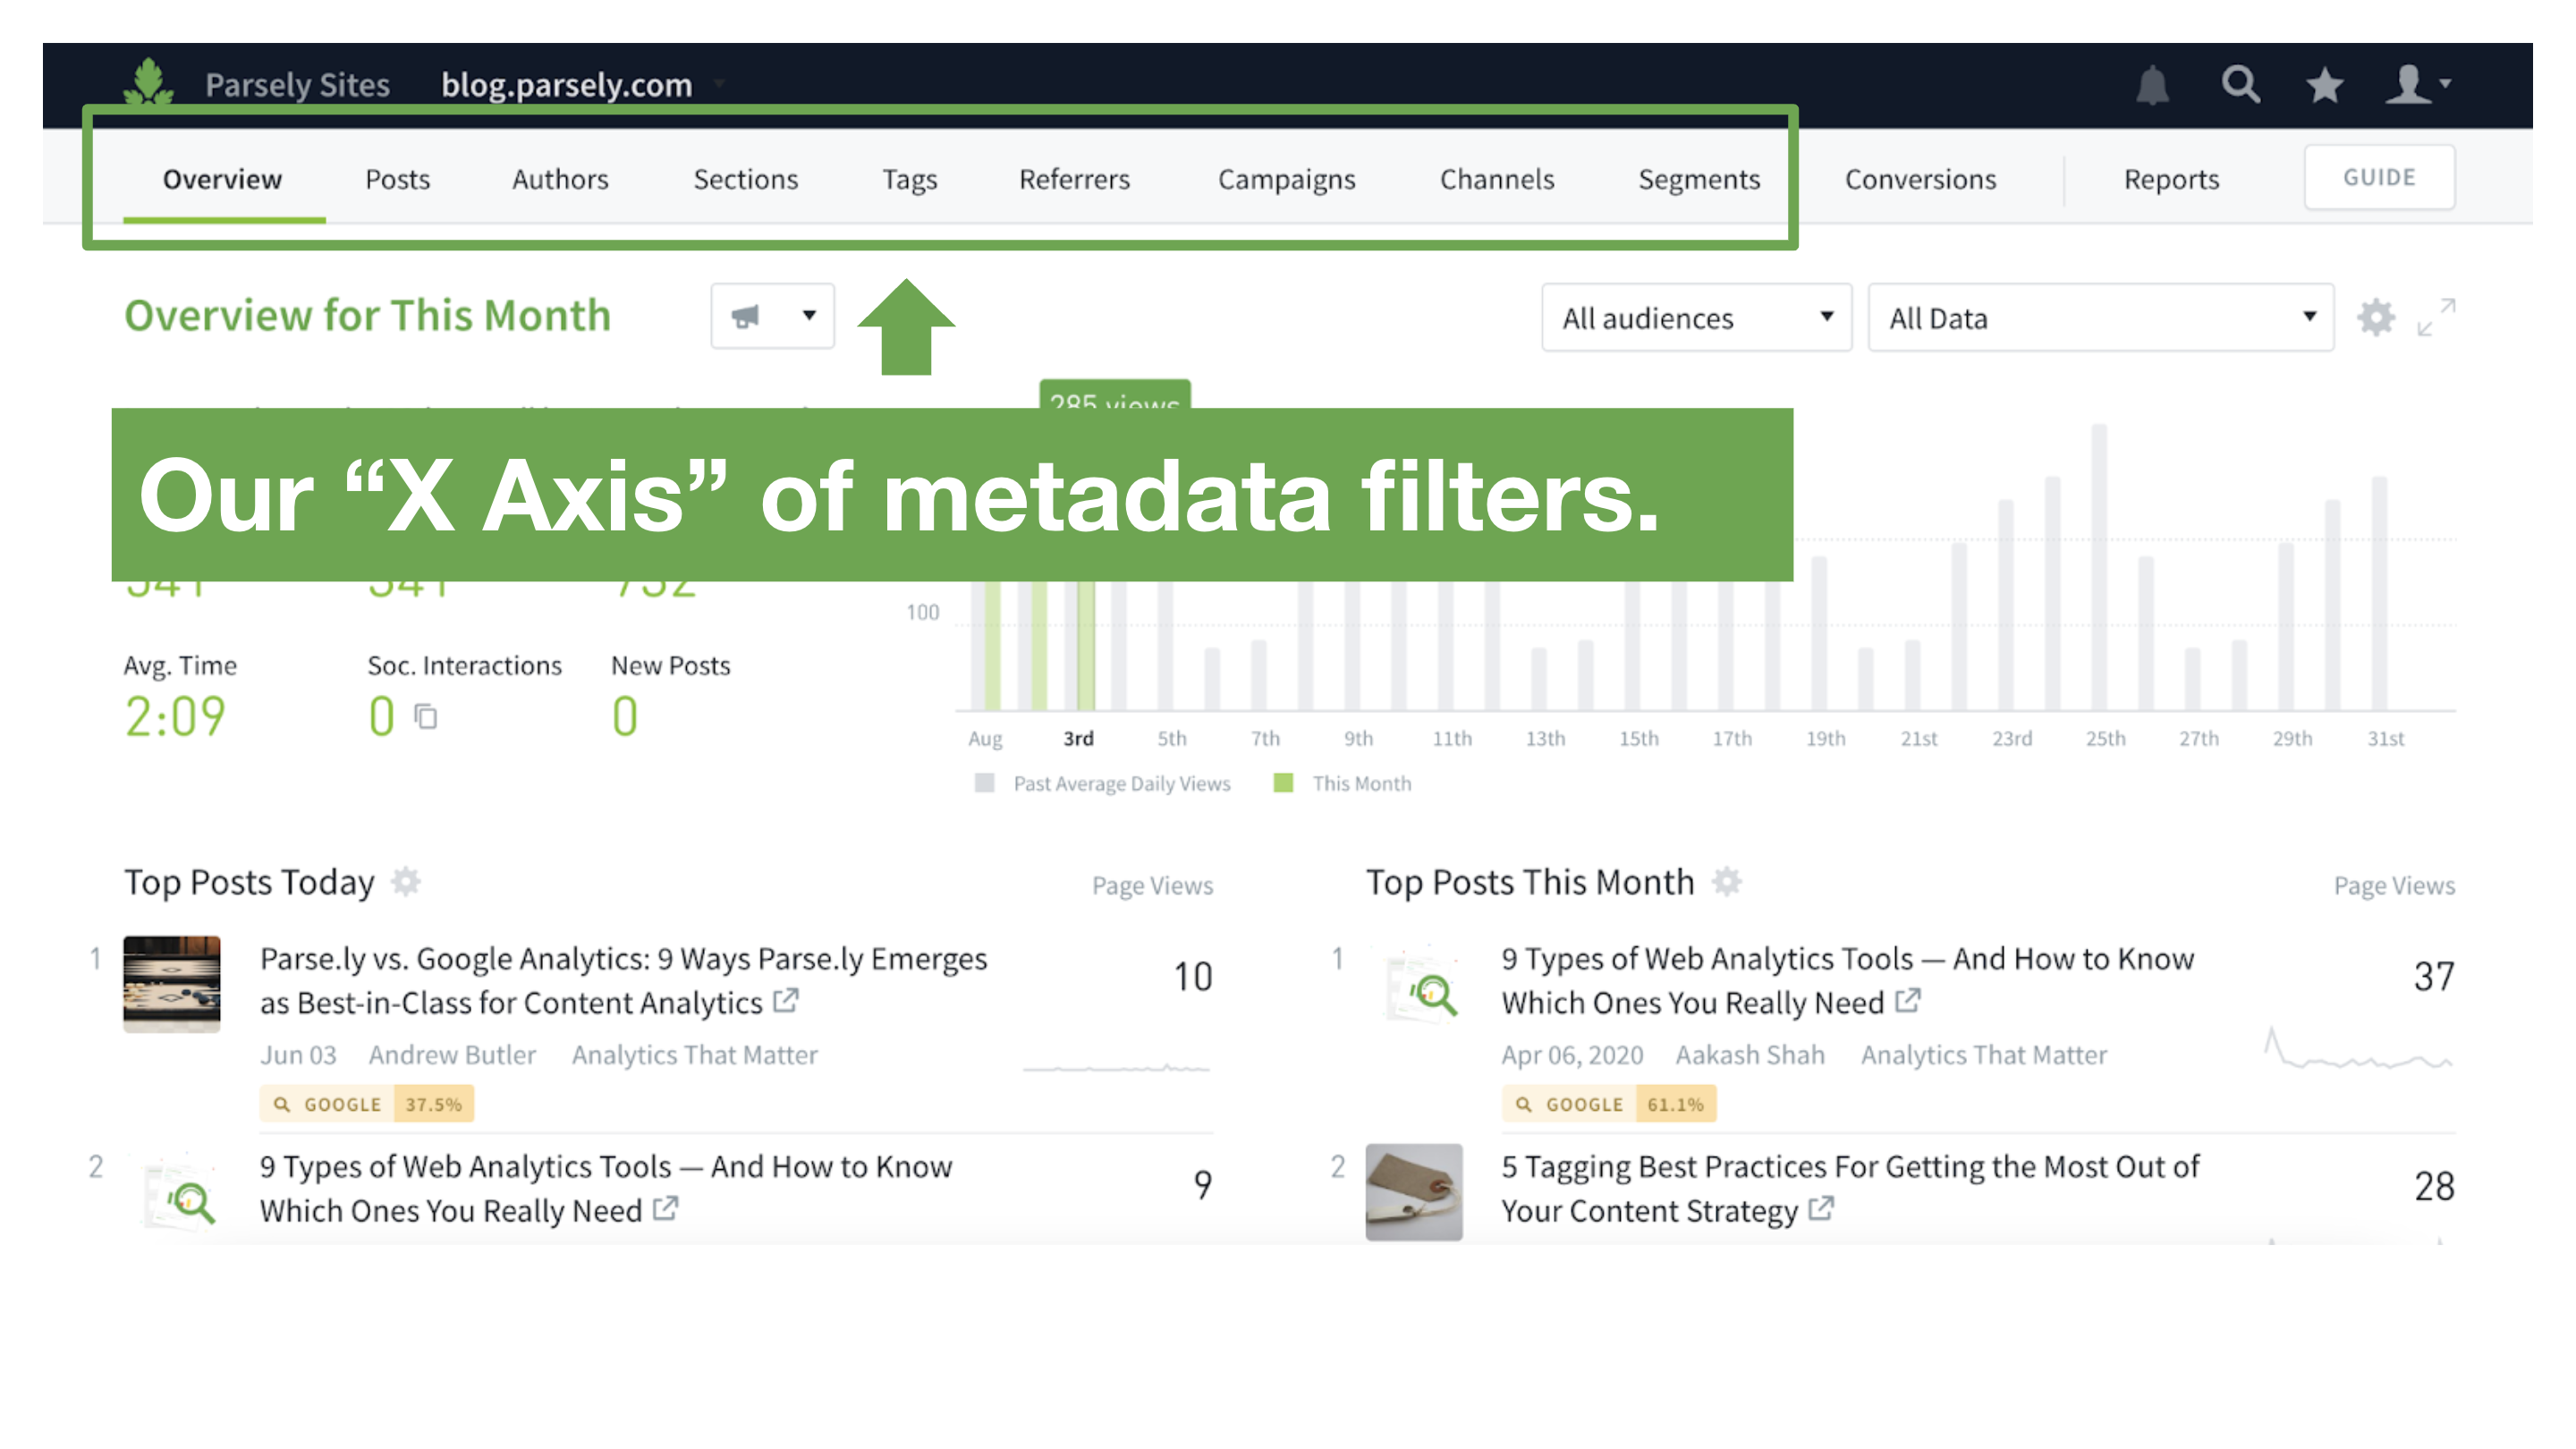
To back up a second, users of the Parse.ly dashboard are familiar with what you could informally call our “X and Y axes”—our metadata and our metrics.
Metadata is data that describes other data. In our case, the “source” data is your content: a blog, for example. The metadata is the data about that content: the article title, author name, URL, and more.
Metrics describe how people interact with content. Examples include total number of visitors, engaged time, and conversions. Recirculation Rate is a new metric. Across the top of the dashboard, you can see the metadata views for your content: authors, sections, tags, referrers, campaigns, channels, and more. These help you narrow down what slice of your metadata you want to explore. This is our “X axis.”
When you’re looking at a specific content type, you can use metrics to sort the performance of your content based on what matters to you most: page views, unique visitors, engaged time, search referrals, conversions, and more. This is what you could call our “Y axis.”
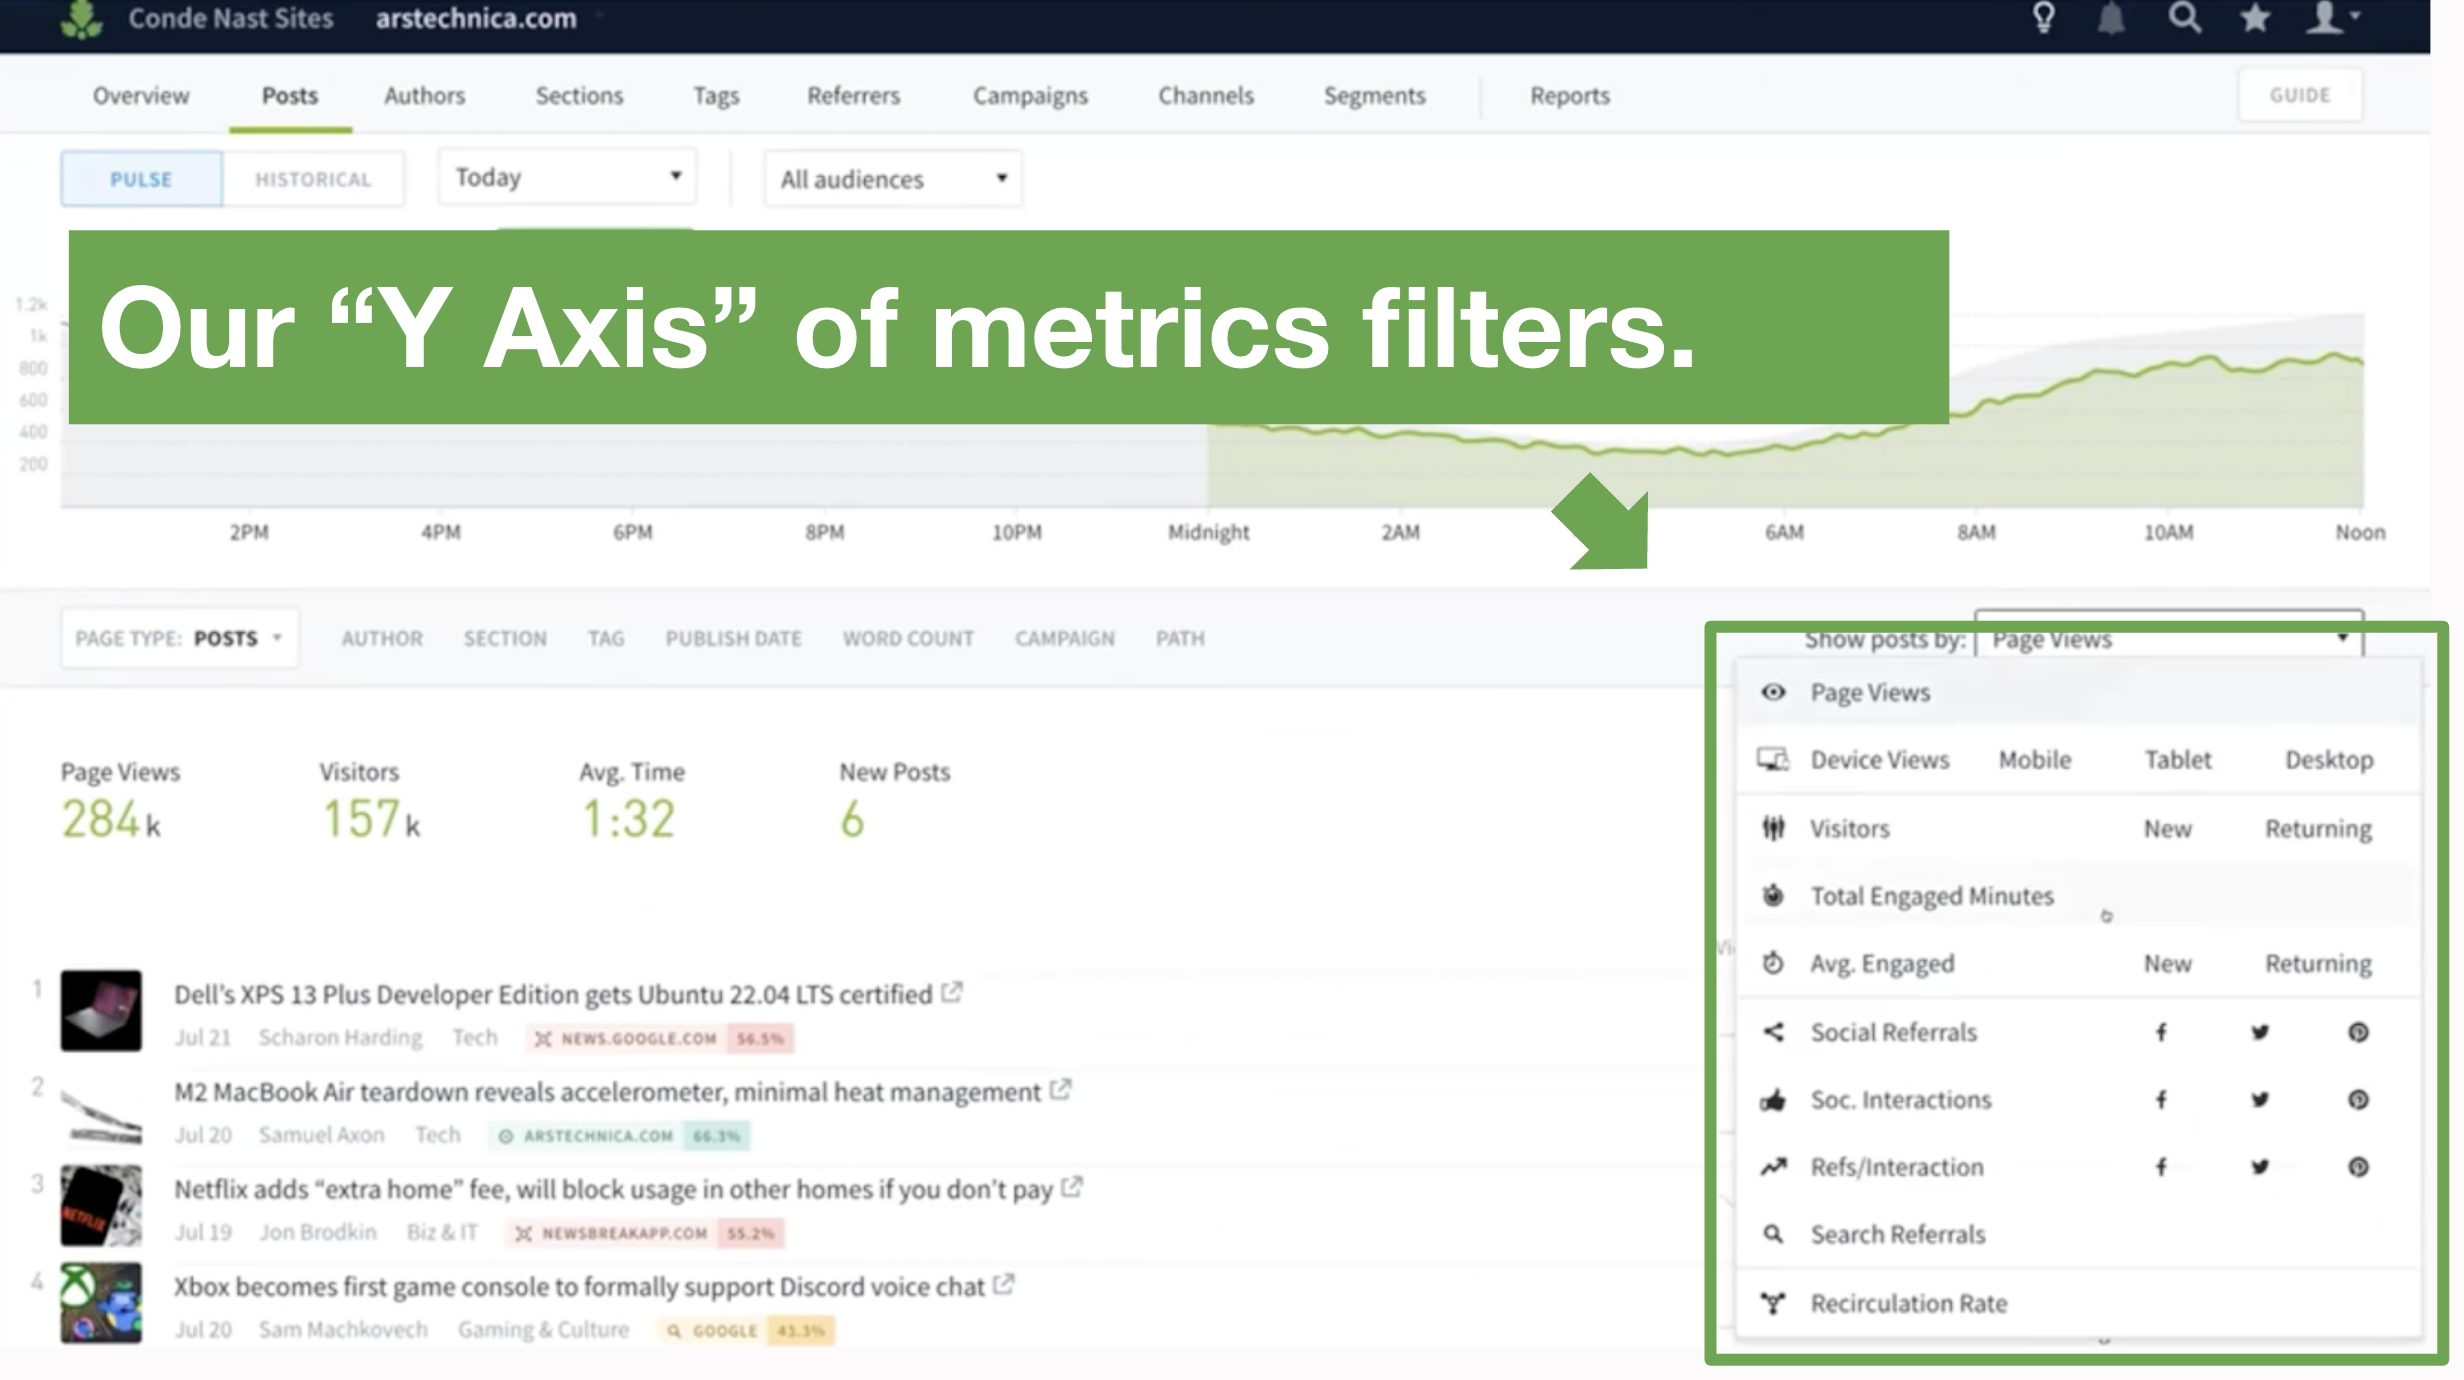
Recirculation rate is a new metric, joining the rest of the metrics on the Y Axis and in the dropdown menu. You can see it at the bottom of that list in the screenshot.
Recirculation rate is us doing some math on your behalf. It is the percentage of views that went to another internal page of the site from a particular page or Post. The formula is:
(Referred Next Views / Total Page Views ) * 100
Another way to think about it is as the opposite of bounce rate—but even better. Bounce rate often has nothing to do with the quality of your content. People could be bouncing because of technical aspects of your site (load time, etc), or because of a popup, or many other reasons.
Bounce rate is a negative metric: “How many people left?” On the other hand, Recirculation Rate is a positive metric, all about your content: “How many people stayed?” A high Recirculation Rate is a much more robust indicator of success than a low bounce rate.
Why is Recirculation Rate important?
We truly believe that this empowers our users with an important view of their content performance—and that’s not just because our customers have been asking for this feature for some time!
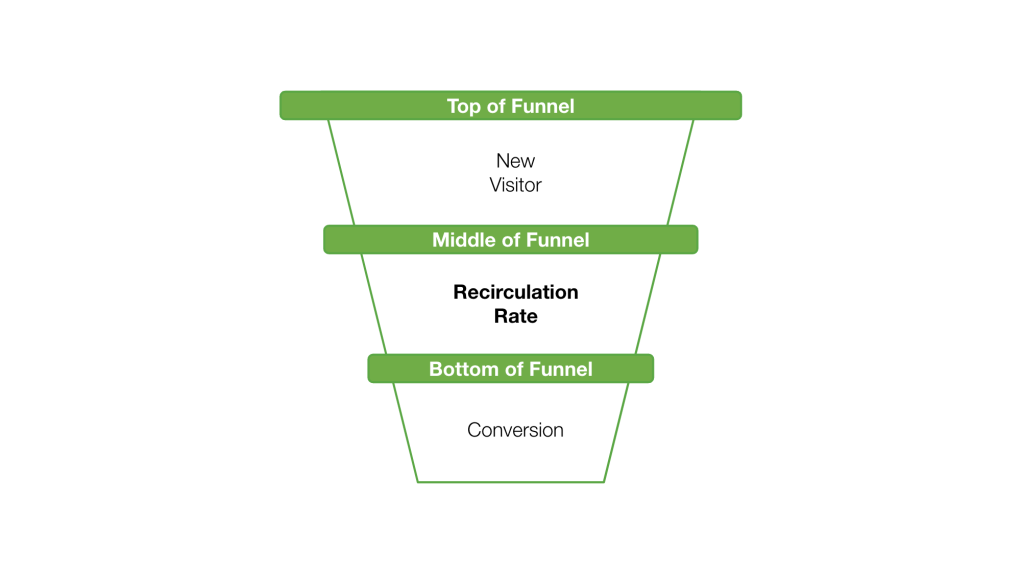
It’s not cheap to acquire new audiences—and retaining them is even harder. Just getting someone on your website will not guarantee that you’re building the kind of relationship with them that you are trying to create. This is why both media and marketers think of their content as a funnel.
You have your top of funnel (TOFU), middle of funnel (MOFU), and bottom of funnel (BOFU). These each roughly correspond to various stages in your customer journey:
- TOFU: Introductions. Getting people to your site from elsewhere on the internet, and introducing them to your brand.
- MOFU: Making the case. Exposing them deeper into your content and brand experience. Warming them up to commit to you.
- BOFU: Decision time. Ushering readers to make a decision, like choosing to subscribe to your journalism, “adding to cart,” or requesting a demo of your product.
Whether you’re a media organization or a corporate marketer, you will have different content that serves different purposes for different stages of the journey.
- Perhaps you first have keyword-heavy content that gets people from Google onto your site. This is your search content.
- Then, you might have content you know people love to read, and you link to it as suggested “You Might Also Be Interested In…” content on your search performance content. This content that people love is your engagement content.
- Then you might have content that drives conversions. For whatever reason, people on that URL decide to buy your shoes, sign up for your webinar, subscribe for your newsletter, or any manner of decisions. This is your conversion content.
These various types of content are generally not all the same in nature! And understanding what type of content moves the metrics you need to move is crucial for designing the kind of experience that beats expectations and increases investment in your team.
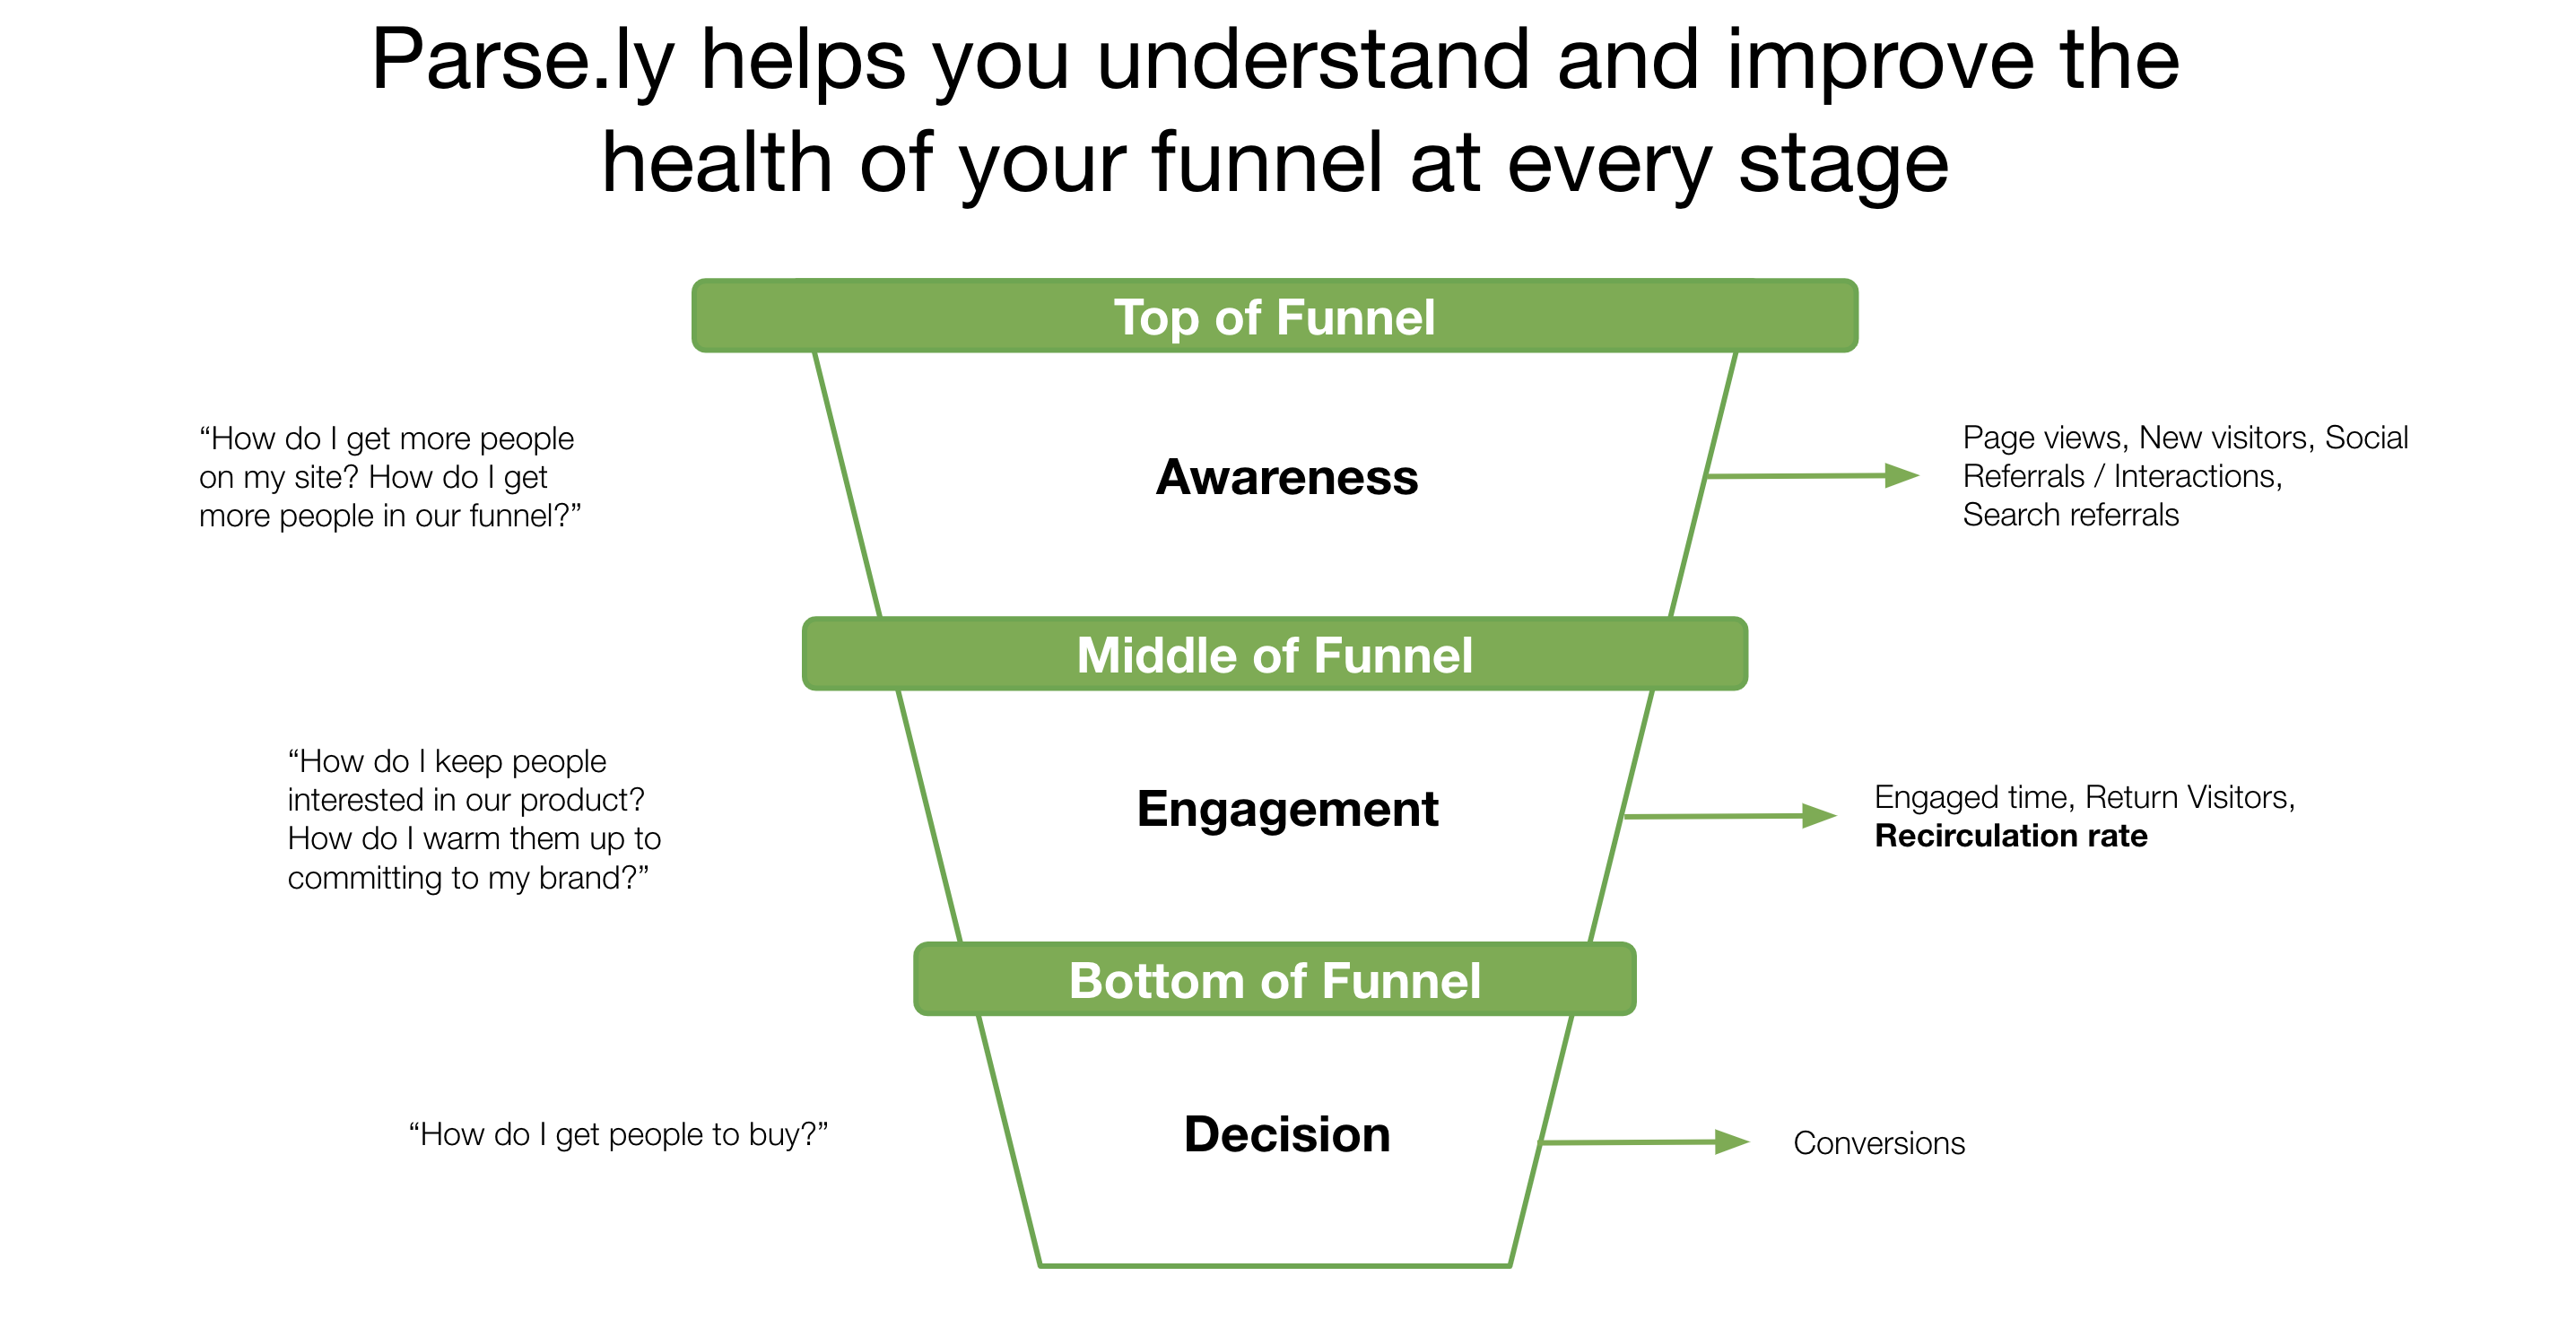
Our mission is to empower you with metrics that allow you to assess each stage of the funnel:
- Top of Funnel Metrics: Page Views, New Visitors, Search Referrals, Social Referrals, Social Interactions, Referrals/Interaction
- Middle of Funnel Metrics: Page Views, Returning Visitors, Recirculation Rate, Device Views, Total Engaged Minutes, Average Engaged Minutes
- Bottom of Funnel Metrics: Conversions
With Parse.ly, you can understand the health of your initiatives to capture market attention.
Example decisions you could make with Recirculation Rate
Here, we’ve collected some hypothetical workflows you might implement using Recirculation Rate.
- Story A is getting lots of traffic but engaged time and recirculation is low. “We’re not targeting the right audience.” Promote the content through different channels to reach the right audience.
- Story B gets lots of traffic and good engagement but recirculation is low. Are there sufficient relevant links to click on? Is the story too long to get the visitor to another page?
- Story C has average traffic but great engagement and recirculation. Promote this story in more places and see if the rates hold up—because if they do, every 1 page view may be worth 1.5 page views based on the recirculation rate.
Have other ideas for how you’d use Recirculation Rate? We’d love to hear them! Send an email to our product team at research@parsely.com. Here’s a quick demo of the Recirculation Rate metric live in the Parse.ly dashboard.
Want to learn more about how Parse.ly users are taking advantage of Recirculation Rate?