The 14 top referrer sources by word count, device type, and categories viewed

If you’re arriving here for the first time, I strongly encourage you to check out Part I of this study, “Predicting sources of traffic to content in 2019“, in which we explore traffic and the reliability of growth for each of the platforms featured here. And if you want to take this data to go, we offer a full download available at the end of this post.
Maybe it’s because I spend a lot of my time around audience engagement teams, but after publishing my analysis on platform growth, my favorite part was the feedback I got from readers. Before we dive into my next analysis, I wanted to clarify something that came from a theme of questions I heard in response to Part I.
How referral traffic growth happens: user growth vs. platform changes
“I don’t know anybody who uses Flipboard or SmartNews.” – everyone that emailed me
I love discovering quirky insights in our data, or anything that challenges my perspective on what I assume to be “normal.” But true breakthroughs or new information from any sort of data, referral or otherwise, actually tend to be few and far between.
That’s usually a good thing. If new surprises popped up every single day, I promise your job would be harder than it is already. Data should not constantly surprise us. And in fact, this SmartNews and Flipboard trend did not surprise us.
Flipboard has been a growing source of referral traffic since 2017. More recently, SmartNews caught our attention in November 2018. Loads of people use these apps, and more every day. In fact, these two apps perfectly illustrate the difference between changes in reader behavior versus changes in product.
Referral growth caused by changes in a product means there’s an app design change or algorithm update that encourages, or discourages, people to come to your site. Overall, Google in 2018 and Facebook in 2017 fell into this category. Google added a number of ways for people to discover content directly in their product, and Facebook, of course, changed their newsfeed algorithm.
Referral growth caused by changes in reader behavior can certainly be influenced by a product changes, but sometimes it’s much simpler than that. While Google and Facebook are unlikely to add many more users, SmartNews and Flipboard have lower market penetration and awareness, which means they have more room to grow. The corollary to this is that many people haven’t heard of them, or heard of a lot of people using them.
More are learning about them though. SmartNews ran television ads in 2018. Flipboard made a technology change that pushes more traffic to sites directly, and has a team of 25-30 editors. Keep an eye on Pinterest from this front in 2019 as they hired their first CMO in late 2018.
The steady pace of growth from these aggregators actually shows the impact of successful product marketing. And, for the record, we do not see any suspicious patterns – like, say, a ton of pageviews at midnight exactly – that would indicate bots or pre-caching pages trying to “fake” the growth numbers.
We can’t say when their user growth will tap out, it’s unlikely that every platform will get to Facebook or Google’s size of course. But right now we see the trend continuing.
And here’s your story from a sample size of one, a longtime Flipboard user myself (there, you know one now), I’ll tell you why I use it: because it came preinstalled on my first smartphone. And it’s not much more complicated than that. In 2012, I had recently moved to NYC and I had a lot of reading time on my commute. My Samsung Galaxy S3, the first Android phone on which Flipboard came preinstalled, had just the solution: a news aggregator for topics I cared about most. It was convenient; now, it’s habit.
Breaking down the aggregate trends by referrer platform
Okay, now to the actual Part II promised. Let this study be an exercise in discovery, rather than a blueprint for gaming the next algorithm.
Zooming in on each platform allows us to put some of the aggregate numbers in context. We looked at content in the last three months (November 2018 through Jan 2019) to get a snapshot of the most current audience interests on each. We examined four dimensions:
- Word count. You have control over how long pieces need to be. Which platforms have an appetite for long form content? Which prefer quick hits?
- Device. Overall, it’s an increasingly mobile world, though the desktop experience still has a place and you should know where. We’ve written extensively about AMP-enabled content, but I cannot stress enough how important it is that we recognize the extent of Google’s influence beyond its own products.
- Content categories by popularity. If you don’t write about politics at all, the fact that SmartNews is growing might not actually be relevant for you. Here’s where you can focus on the platforms that work for you.
- Content categories by demand. We define demand for categories as the average views per post. Content in demand is a powerful metric to identify relatively under-covered topics, and a way to find audiences that maybe want to pay more attention to what you write about.
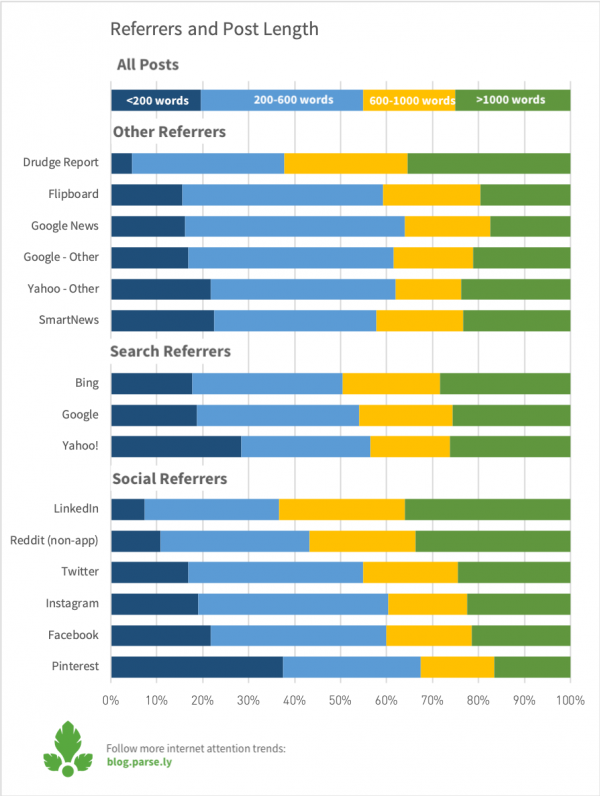
Word count by platform
Of the millions of posts published since November 2018 that we studied, the median length by word count is 529, with a lower quartile of 261 words and an upper quartile of 998 words. Most content ranges between about 200-600 words.
Platforms where very short text posts do best include Pinterest, Facebook, Instagram, SmartNews, and both Yahoo Search and other Yahoo referrals. In the case of Pinterest, image heavy posts or short instructional ones might do best. In the case of Facebook, perhaps it relates to the stat reported by Bloomberg that while users spend 45 min a day on Facebook, “the average Facebook session lasted less than 90 seconds […] while you were waiting in a checkout line, trying to avoid eye contact between subway stops, or sitting on the toilet.”
Linkedin, Reddit (non-app), and the Drudge Report refer proportionally more traffic to long-form (over 1000 words) posts.
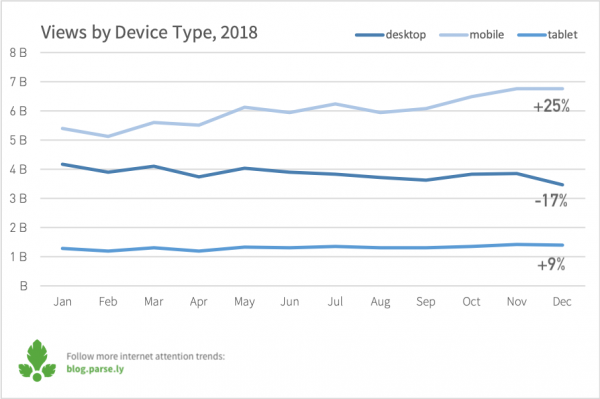
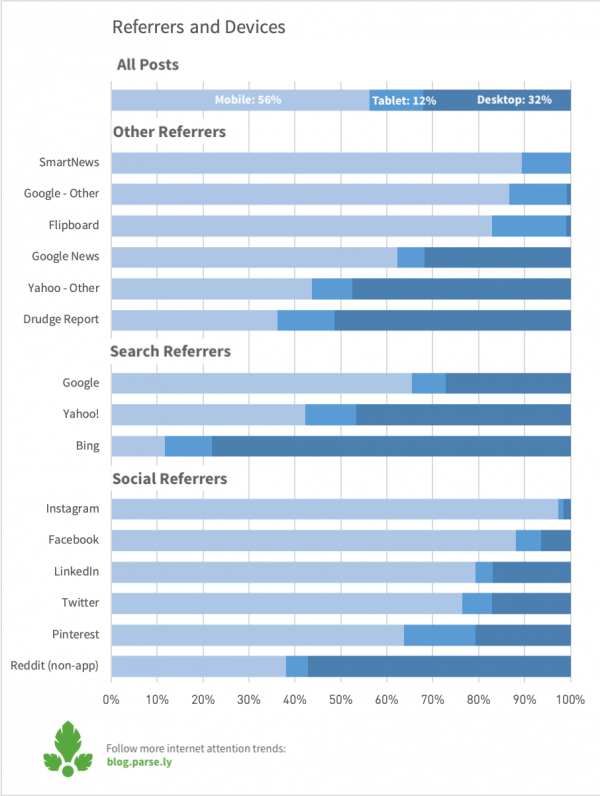
Device usage by platform referral
Mobile traffic grew 25% during 2018. This matches other trend reports in the market, including Mary Meeker’s report showing growth in both time spent with mobile devices and tablets and other connected devices, but a slight decline on desktop.
And surprise, surprise, the apps that saw the most growth last year, SmartNews, Flipboard, Instagram, Google-Other, also tend to have most if not all of their audience on mobile. More search based platforms, Google News and Search platforms buck this trend, with high desktop percentages still.
However, the desktop experience is not dead! It has much higher rates with direct and internal traffic referrals. This could indicate that people more commonly click links from email and chat apps (Slack, anyone?) on their desktop. Related content or “read next” modules likely work better when there’s more screen to see them.
Desktop traffic also corresponds slightly more to business content and long-reads, with platforms like LinkedIn showing a higher percentage of readers in both categories. (Don’t confuse this with the idea that people won’t read long-form on mobile, they do.)
One slightly surprising exception to this is Pinterest, with lots of short posts, steady referral traffic, but also a higher desktop audience. The new CMO described the Pinterest audience as “very unique” to AdWeek, saying “We’ve learned that users turn to Pinterest when they are actively looking for something, but still open-minded about what the specific answer could be.” Perhaps that unique mindset means the referrals function more like search than other social networks.
With mobile traffic comes a slow takeover of AMP. AMP is a Google product, sure, but expands far beyond Google-owned products. It may help to think of it as a quick-loading template, rather than a channel or platform itself–that is, a template that can be used across any platform, but which opens in a Google webview (i.e. not your default mobile browser). And it’s everywhere – stay tuned on this front.
Content category popularity and demand by platform
A little context for categories first. As part of our Currents platform, our system reads the full text of every post on our network to determine what the article was about. (You can read about how we use NLP and machine learning to do this here, but we’ll skip the details for this post.) We’ll explore the top 10 categories per platform, and you can explore the full list of categories here.
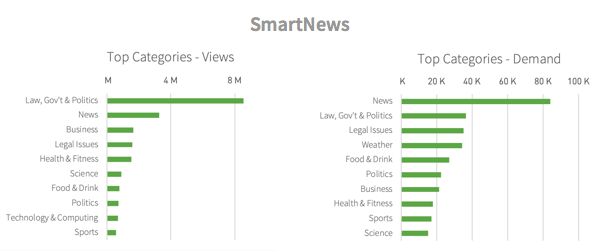
For popularity, the metric we’re looking at is simple: total number of pageviews for a category from the referrer.
For demand however, we’re looking at a slightly more nuanced view – how many views per article are there. This can mean that people would like to read more about a category and that there isn’t enough on the platform. However, it can also mean that it’s a category with a lot of articles. For example: Sports as a category tends to appear in “low demand.” There are more articles written about sports, and many are short summaries of trades or scores, which predictably don’t bring huge volumes of readers per post.
If you’re trying to decide which platform to invest resources in, consider our growth stats from Part I.
But also consider where your content falls in these lists below. Is it a category that’s in high demand? Is it popular, but heavily saturated? If a platform poses an interesting opportunity for you, consider experimenting with the in-demand categories, which could garner higher views per post.
Platforms by content category popularity and demand
Each referral source’s categories for the Nov 2018-Jan 2019 timeframe is shown below in order of 2018 views growth. Law, Government & Politics tops many of the referral sources for popularity, as it’s the most read about category across our network. The three exceptions to this include Pinterest, Instagram, and LinkedIn, though Law, Government & Politics ranks highly still for both Instagram and LinkedIn (it’s no where to be seen for Pinterest). Google Search and Twitter both have Sports as their second most popular category.
Demand varies much more widely across the different platforms. To explore any category further, or see more recent data, click through to check it out in Currents.
SmartNews
Explore SmartNews referrals in Currents
Google News
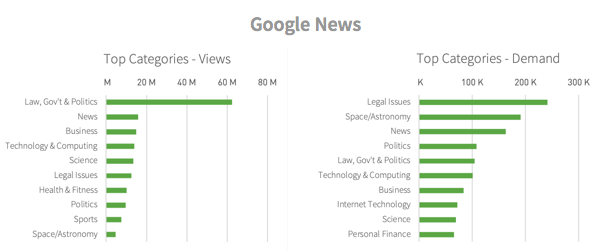
Explore Google News referrals in Currents
Google – Other
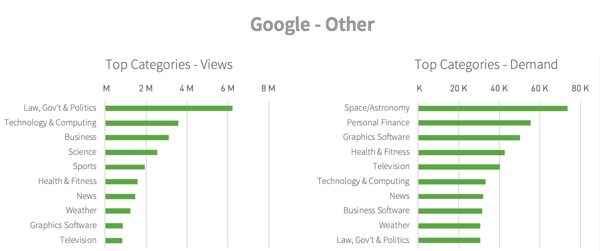
Explore Google – Other referrals in Currents
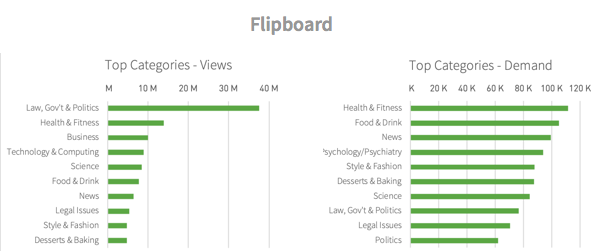
Explore Flipboard referrals in Currents
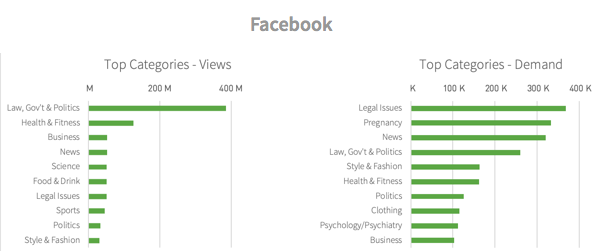
Explore Facebook referrals in Currents
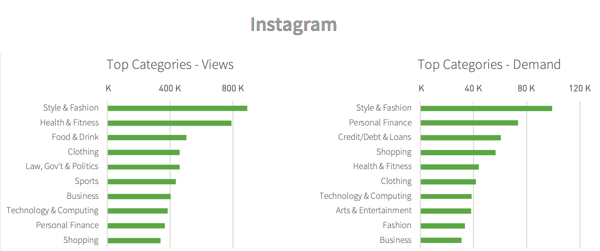
Explore Instagram referrals in Currents
Bing
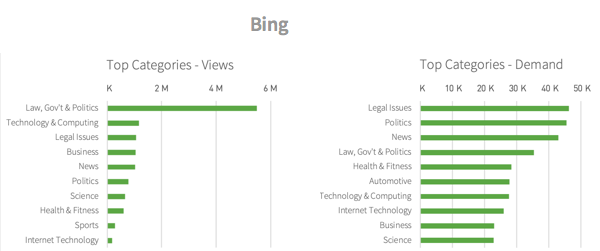
Explore Bing referrals in Currents
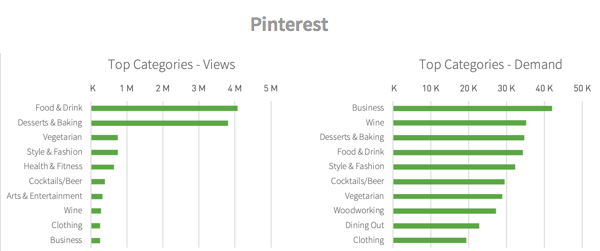
Explore Pinterest referrals in Currents
Google Search
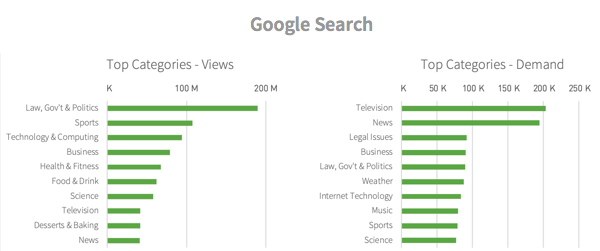
Explore Google Search referrals in Currents
Yahoo! Search
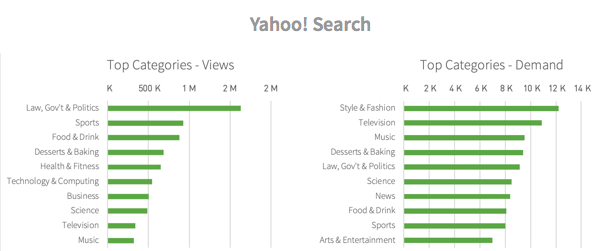
Explore Yahoo! Search referrals in Currents
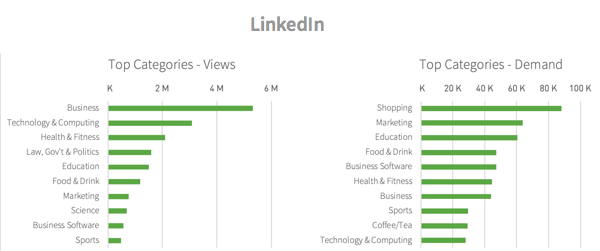
Explore LinkedIn referrals in Currents
Drudge Report
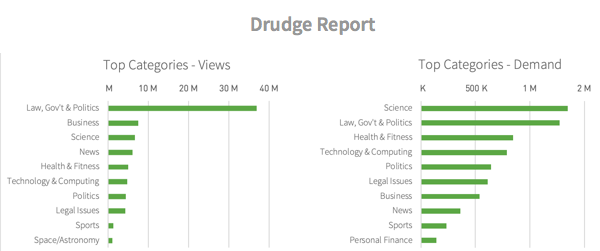
Explore Drudge Report referrals in Currents
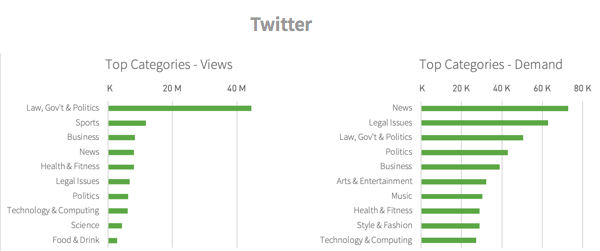
Explore Twitter referrals in Currents
Yahoo – Other
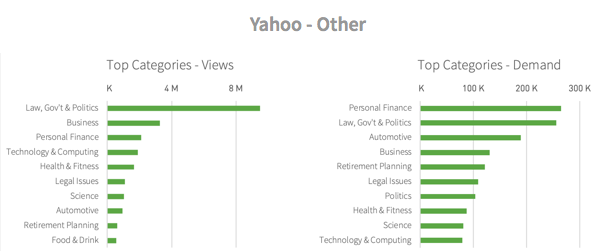
Explore Yahoo – Other referrals in Currents
If you made this far down, I’ll add that there was another piece of feedback that I loved hearing: “Thank you for validating me and my work.”
And so to wrap this study, No – thank you for you and your work. You’re the one making these things happen.
Did something confirm your suspicions? Seeing something completely different than what we’re seeing with your data? As always, tell me about it! I promise to dive into the numbers with you.
And if you’d like to take all of this information with you or dive into a specific referrer, sign up to download the full PDF of every referral source, the specific numbers for each, and my hot-take on each one.