Usership: the Only Thing That Matters With Analytics

When it comes to analytics, usership is the only metric that matters. Zuora’s CEO, Tien Tzuo, explains what usership is in very simple terms:
“Start paying attention to consumption, as opposed to unit sales. Miles driven, not cars sold. Hours played, not games shipped. Features used, not applications downloaded. That’s where the real value lies. That’s where the usership lives.”
However, many teams are instinctively drawn to framing their evaluation efforts differently: “What about the cost of the contract? What about integration time? What about the ability to source [insert very specific metric]?”
We’re not discounting those, especially when integrations are painful (which is, in fact, the No. 1 concern cited by marketing operations personnel across all categories). But diving into the data makes the answer clear.
To prove it, we’ll be looking at data from the recently published Martech Trends 2022 Report, the Content Matters 2022 Report published earlier this year, and internal and external case studies run by the Parse.ly product team.
Just installing Google Analytics doesn’t get the job done
Our Martech Trends 2022 Report analyzed responses from more than 800 marketing professionals—chiefly content marketers, CMOs, marketing operations, demand marketers. It spotlights how marketing organizations are building their marketing stack around their core content management system (CMS), and the challenges doing so. They told us what they were prioritizing, technologies they use, confidence levels, and more.
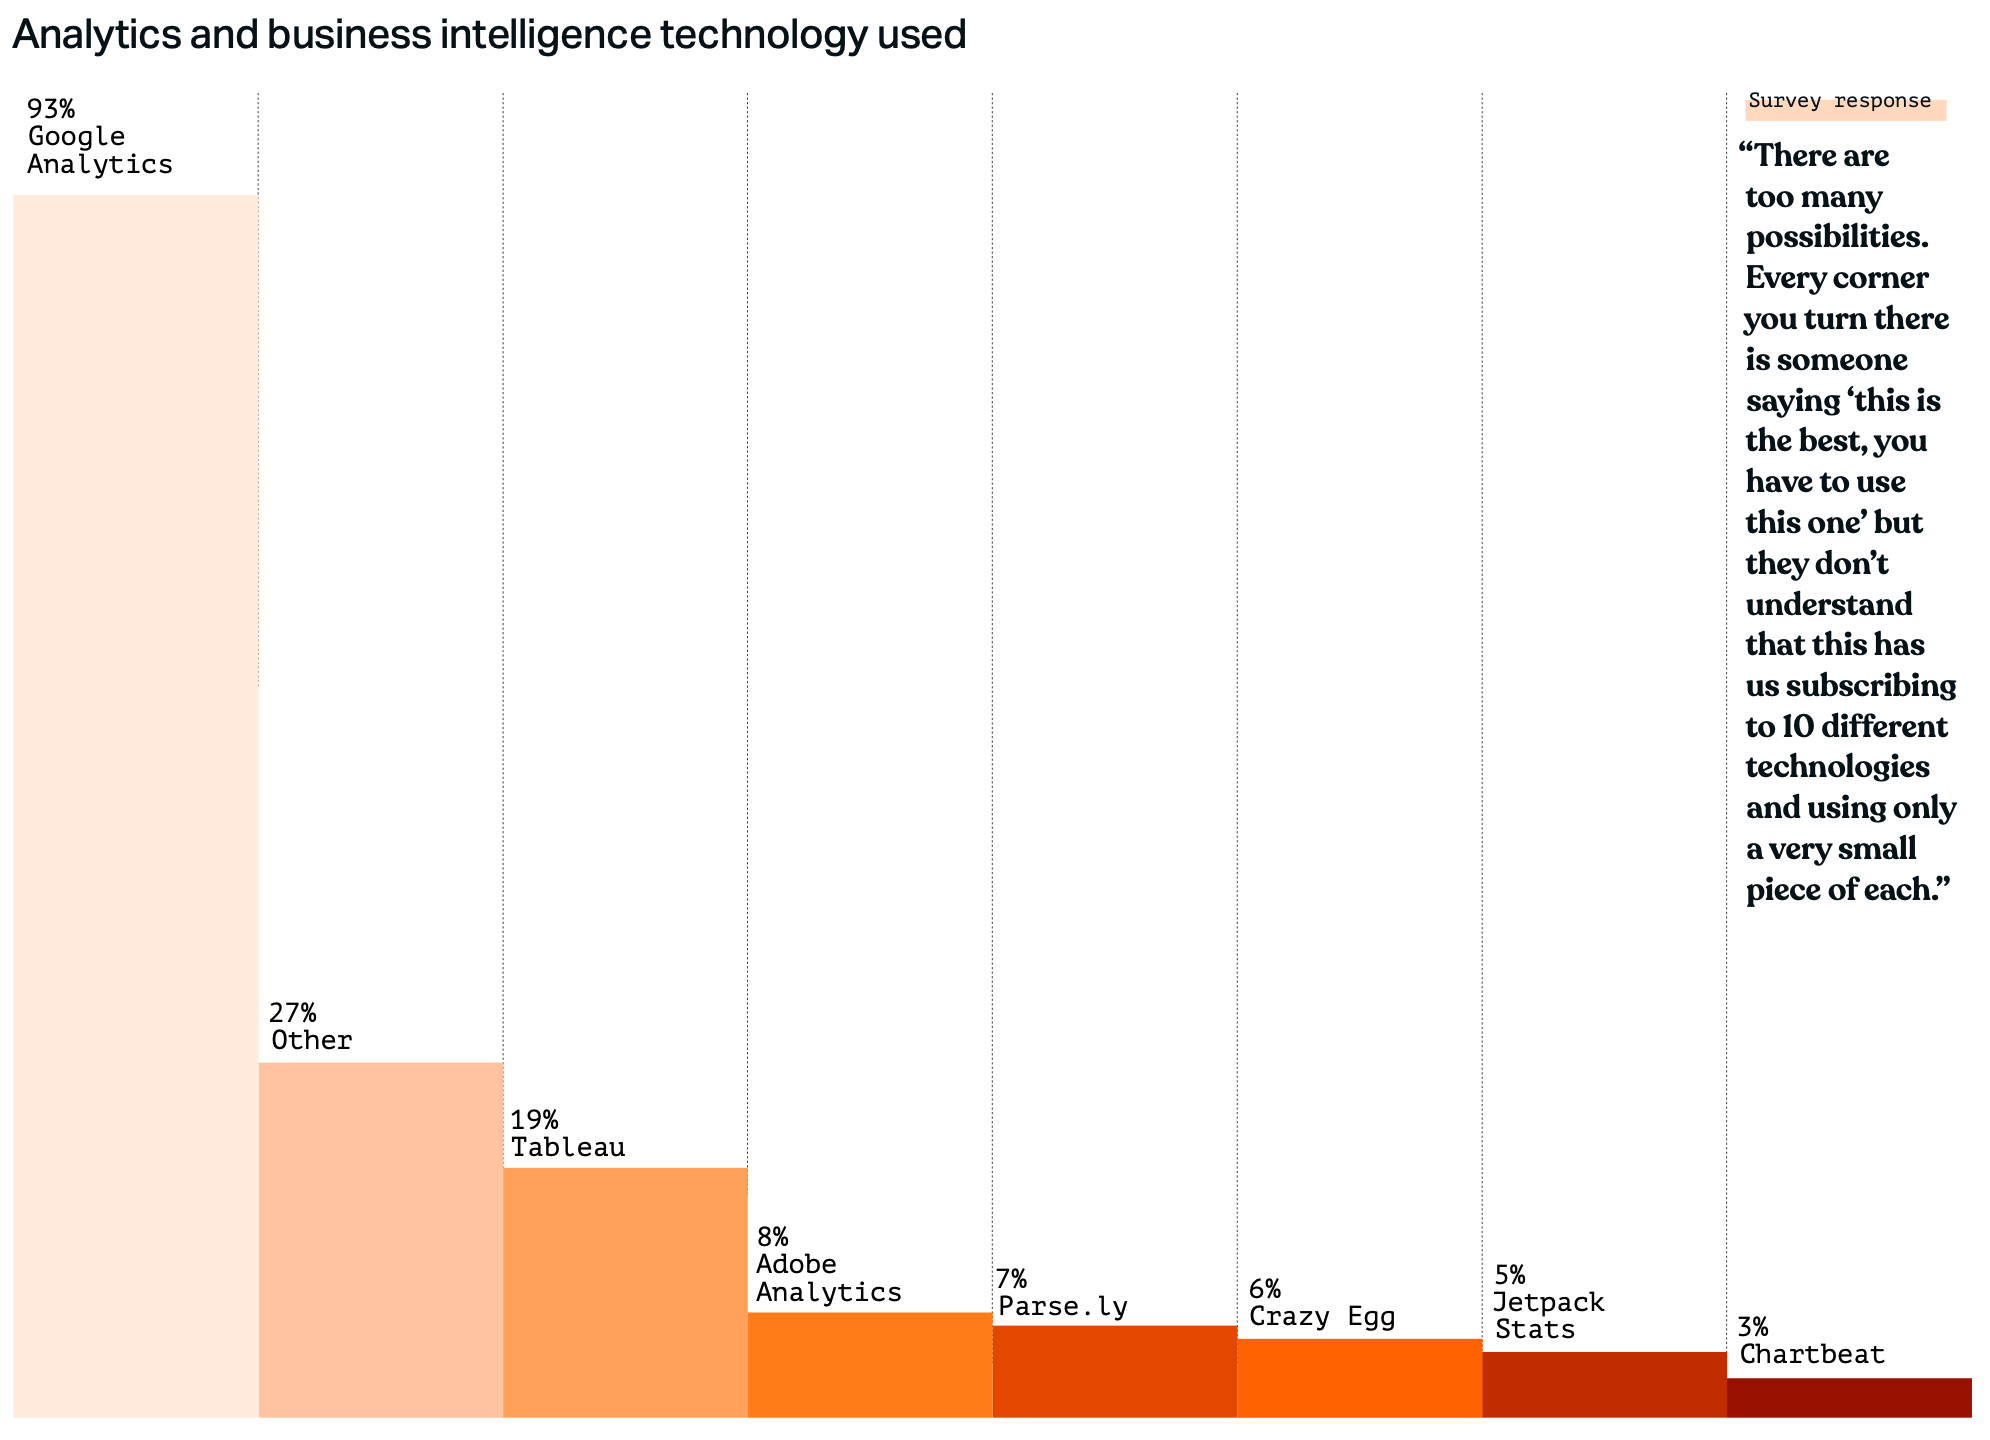
The first thing the data tells us is that (nearly) every website has Google Analytics installed (86% of all websites, and 93% of those using analytics software). This makes sense: GA is both free and critical for measuring the success of AdWords spend.
The second thing the data tells us is that installing GA on your site doesn’t get the job done. How do we know that? In our earlier Content Matters 2022 Report, 49% of respondents told us they don’t know how their content is performing.
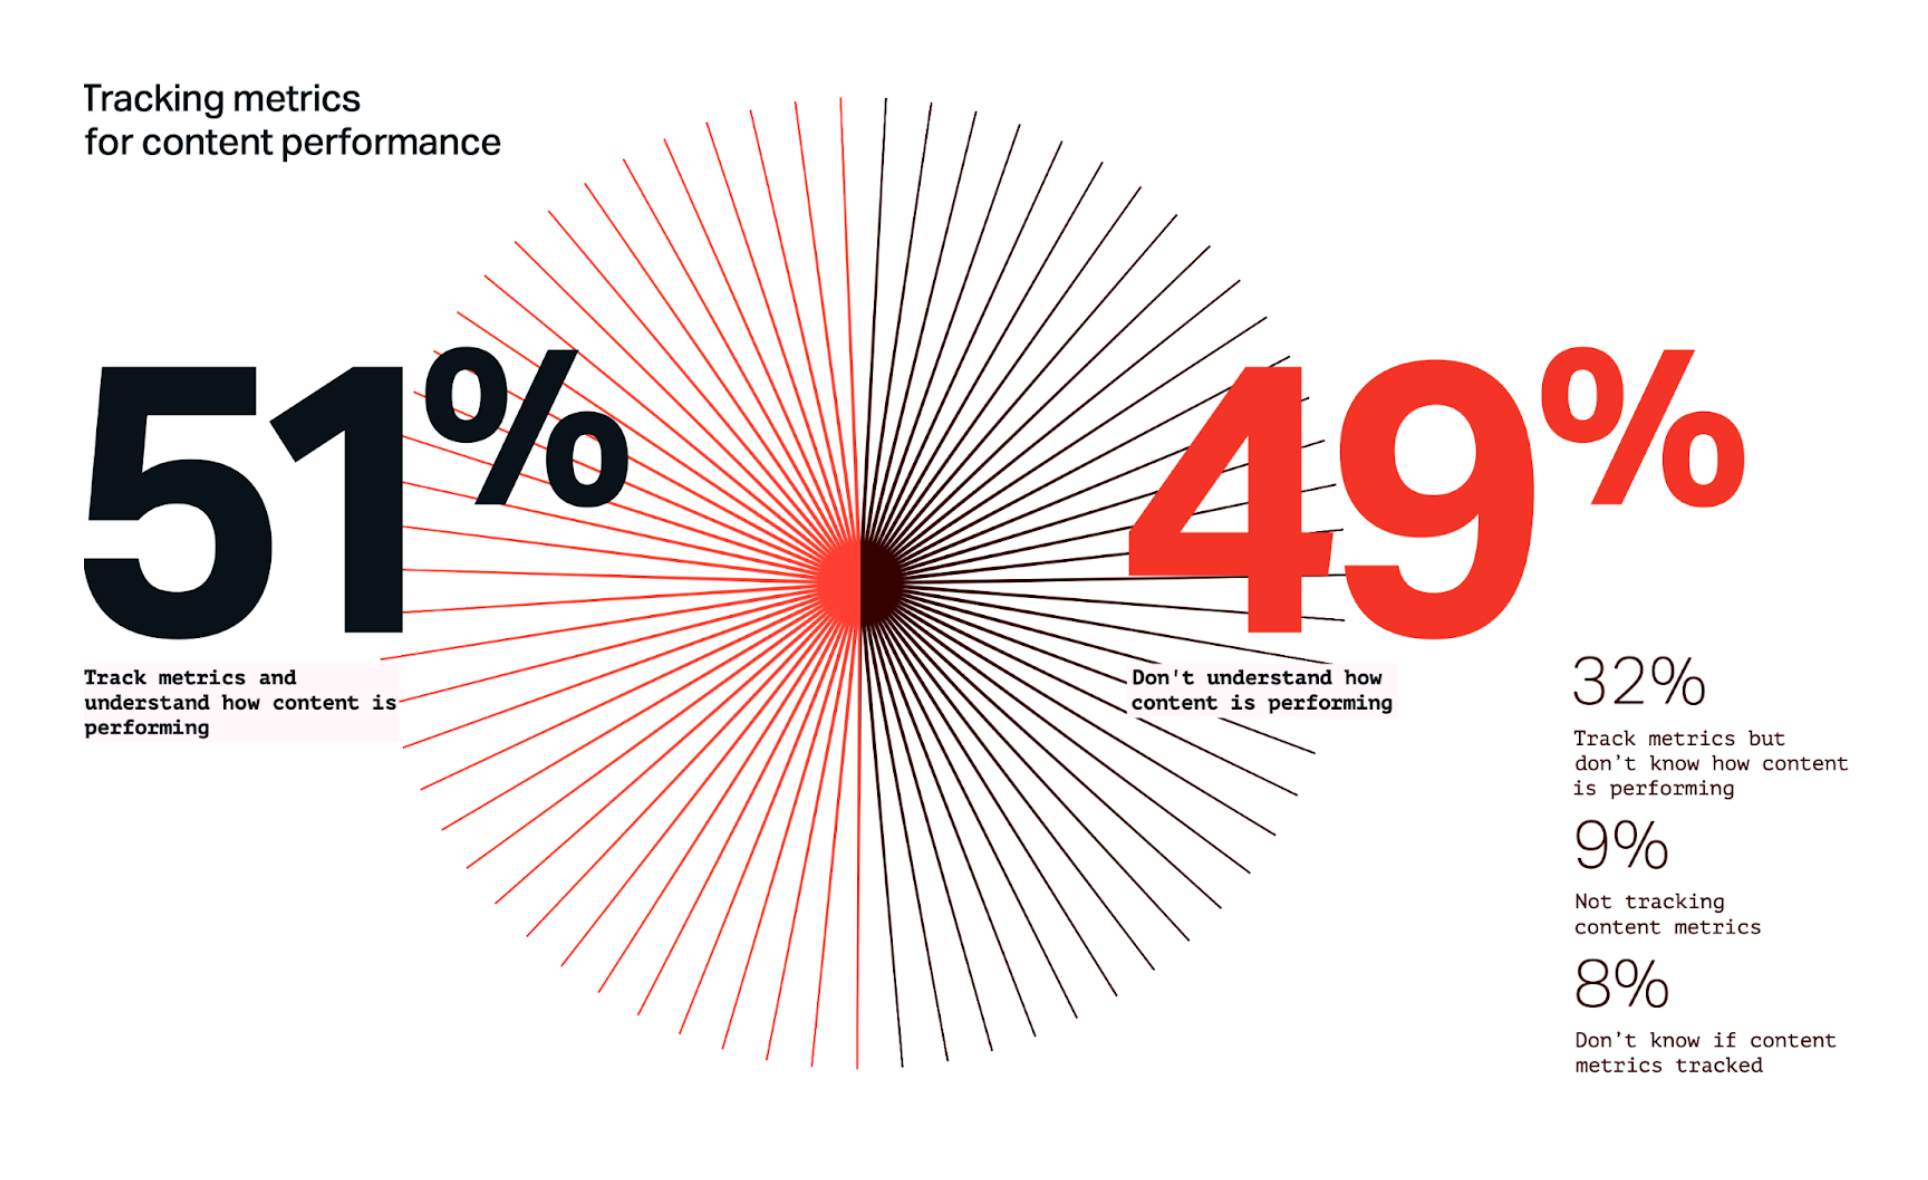
So, there’s a tool that everyone has installed. Yet one in two marketers are unsure of the results of all the effort they put into content.
This leads us to ask: what’s the confidence level of folks who actually use GA? Remember, just because a company has GA installed on their website doesn’t mean their entire content team knows how to use the tool (or even has a login).
The confidence of actual users of the tool
Let’s drill down into the data, looking specifically at employees who regularly use analytics tools (instead of just everyone on a content team). Here’s how many people reported being confident in their understanding of their content performance:
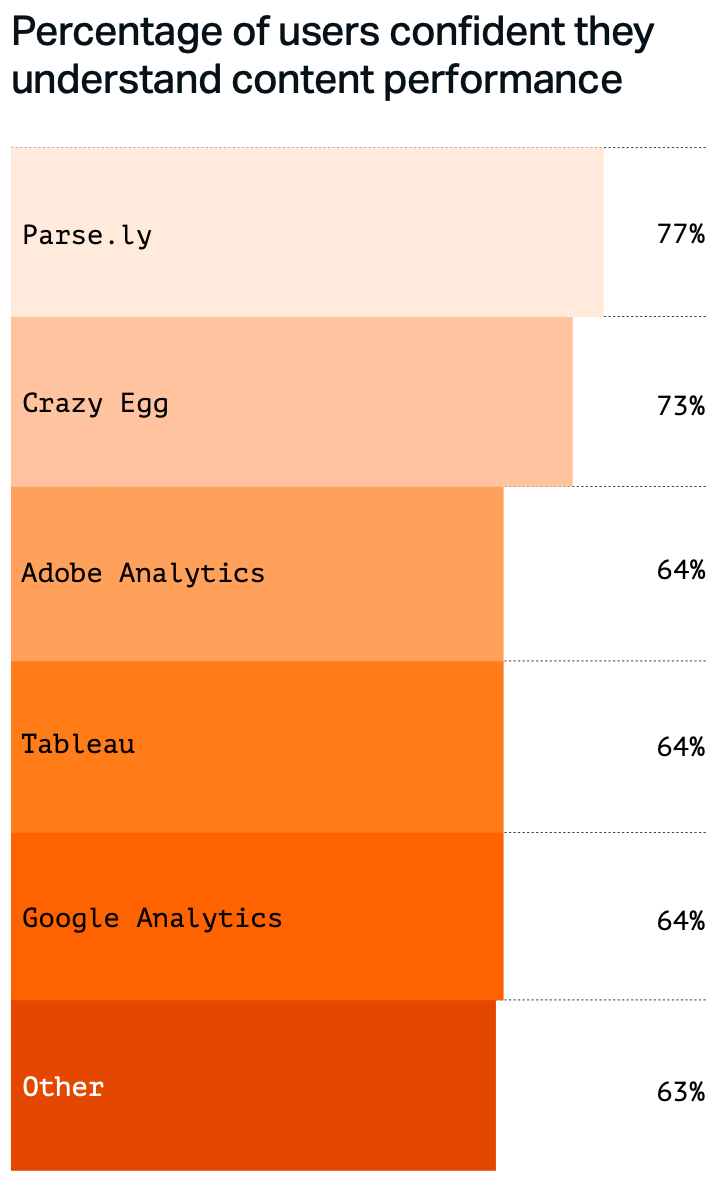
That’s not a large delta—only a 13% difference between first and fifth place.
This tells us the ability to source content metrics is a commoditized market across the leading tools used by marketers today.
Nearly all tools can give teams the metrics they regularly use: page views, visitor count, engaged time, conversions, and so on. There are very few examples of “magic data” that only one tool can give you. In essence, if you have a specific question, and enough time, training, and willpower, one of these tools will likely get you the answer.
So is that where the story ends? Should you throw a dart at the wall or just choose the cheapest analytics option?
Neither. There’s a reason why companies see triple-digit improvements in page views and conversions when they adopt Parse.ly (part of the WordPress VIP platform), instead of using GA only.
It is critically important to evaluate actual real-world usage of the analytics tool.
- How long does it take to learn how to use it?
- How many of your team members log in to it on a regular basis?
- How long does it take to put together reports you need?
Excess friction related to any of those questions will lead to less data usage across the team. It’s part of why half of all content marketers don’t understand the performance of their work. Here’s another telling statistic: the No. 1 source of new content topics is other teams’ “good ideas.”
Making the mathematical case for usership
Every content marketer has been approached by a teammate saying, “Hey, I think this would be a good topic for a blog.” And every content marketer knows that that’s not a solid foundation for content strategy.
The reason behind that reality comes back to usership. Even though it’s likely installed, GA doesn’t enjoy wide adoption—it’s difficult to learn, unintuitive, and clunky.
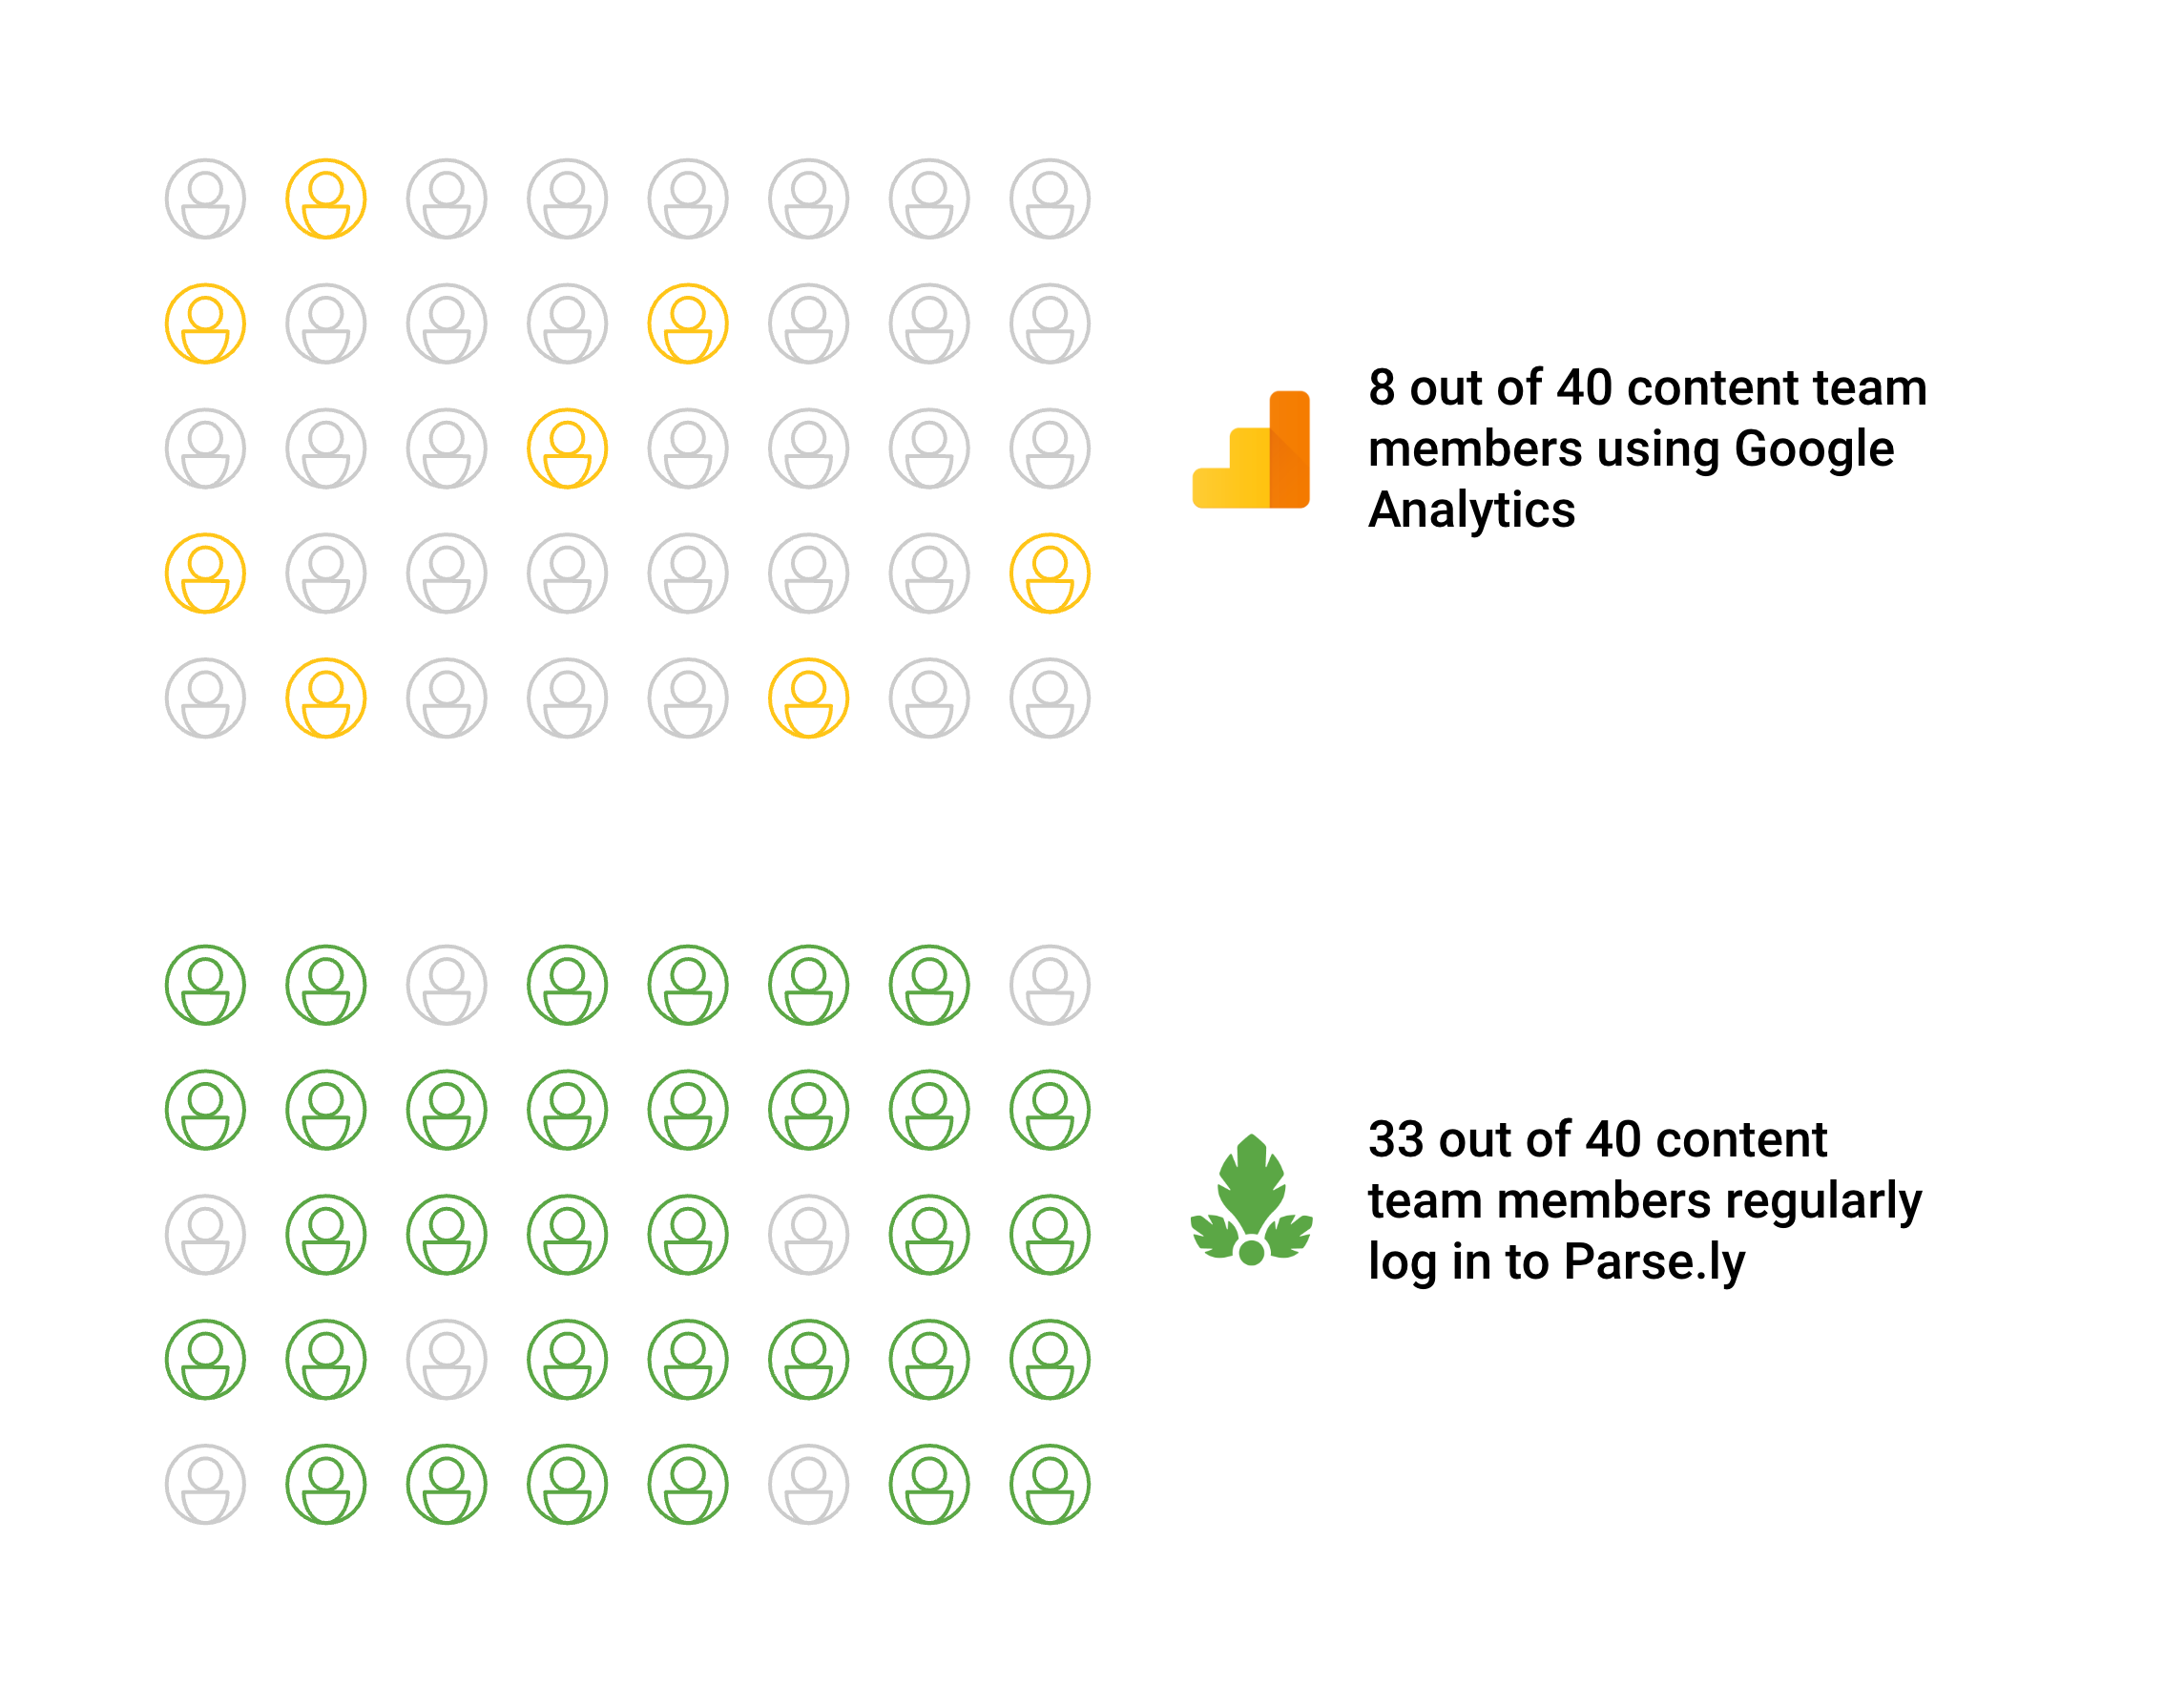
To prove this, let’s contextualize things. Parse.ly has run a number of customer studies, both internal-only and public-facing, analyzing tools usership. In particular, we found that Google Analytics has regular use among 18% of content team members. The whole company has it, but fewer than two in 10 of the content team use it. On the other hand, Parse.ly has 84% regular use.
Do the math. If you are a large organization that uses Google Analytics, say, with 100 people involved in content (e.g., writers, analysts, editors), 18 will be able to ask questions of the data. Now, looking at the facts in our Martech Trends 2022 Report, 64% of those 18 regular users will be confident that they understand what they’re looking at. This means only 11 people in the org are enabled to be data-driven.
If you take that same organization and introduce Parse.ly to it, 84 members of the team will be able to ask questions of the data. And 77% will be able to understand the answers they’re looking at. This means 64 members of the team are enabled to be data-driven.
11 versus 64: That’s a difference of 581%.
Most analytics tools can provide the answers you’re looking for. But only some make it easy.
The point of analytics tools is to make your team data-driven. A 581% difference in their ability to do so is why usership is the only metric that matters in this space—and why it blows other concerns out of the water.