6 Ways to Make Content Analytics a Team Effort

You know data-driven decisions play a key role in growth, but getting everyone to habitually use data isn’t always easy.
Luckily, there are easy ways to encourage your team to incorporate data into day-to-day decisions and answer questions like:
- How do I get people to start using data?
- What is my team writing about?
- How do I know how a story is performing?
- How do I leverage trending content?
- How do I improve reader loyalty?
- How do I identify underperforming content?
1. How do I get people to start using data?
The key here is making it easier for people to access the data.
Send shareable links.
Parse.ly offers shareable links you can send to people who may not have access to the platform itself. This is a great way to get people looking at data without having to train them on new software.
Use bookmarklets.
Parse.ly’s bookmarklets feature lets you open the analytics for any page you’re on. For example, if you’re viewing a blog post on your site, click the bookmarklet to take you to that post’s performance in the Parse.ly dashboard.
Try it for yourself! In Google Chrome, add the following javascript as the URL in a new bookmark:
javascript:(function()%7Bif(!window.PARSELY)%7Balert(%27Parse.ly is not loaded on this page.%27)%3Breturn%7Dvar e%3D(window.PARSELY.config %7C%7C %7B%7D).apikey %7C%7C document.getElementById(%27parsely-cfg%27).getAttribute(%27data-parsely-site%27)%3Bvar t%3D%27https://dash.parsely.com/%27%2Be%2B%27/find%3Furl%3D%27%2BencodeURIComponent(window.location.href)%3Bwindow.open(t,%27_blank%27)%7D)()Sign people up for reports.
Be aggressive. Sign people up for reports they should see, including their email so they get the data delivered right to their inbox.
Removing the sign-up step from the equation makes team involvement instantaneous. We hear regularly that once people start seeing reports, they begin to understand their value—and start to generate new ones on their own.
The accessibility of these delivered reports gives everyone access to the same data, which ensures your team discussions will be informed and purposeful.
Don’t be afraid to be aggressive about signing up people for reports. They’ll thank you later.
Doyle Irvin, Product Marketer, Parse.ly
Make the data highly visible.
For some of our customers, this means displaying the Parse.ly dashboard on a big screen or monitor at the office. For others, it’s setting up a Slack alert for top-performing stories. Whatever your approach, make sure your entire team is able to see analytics every day.

Check who is logging in.
Determine who is likely using data in their decisions by noting who is actually logging into your analytics tool. Some may need that extra push or assistance incorporating data into their daily workflows. Provide a list of things to do when they log in to simplify the process.
Do this in Parse.ly by clicking the profile dropdown menu. Select Parse.ly Usage to view the list of top users for that site. You can also view what areas of the dashboard people access.
2. What is my team writing about?
A typical analytics habit involves checking top-performing posts. Unfortunately, that only gives you a small piece of the puzzle, making it more difficult to quickly share feedback to your team.
Instead, look at posts by publish date to gain a more accurate view of performance for related posts. For example, if you look at posts published yesterday and today, check the posts ranking at the bottom (or run the Parse.ly Bottoms Listings Report for a monthly view).
Ask your team what they think may be the issues, using data to think critically and answer their hypotheses. Encourage them to update and improve each post’s performance, based on what they learn.
There are other ways to assess topics, like reviewing top posts by campaign, tag, section, etc. Look at your metrics holistically instead of just pageviews. What’s driving the most search results? What’s bringing in the most social referrals? Use those metrics as a reference to establish best practices for topics, word count, and more.
Work backwards from your results to identify what effective content looks like for your organization.
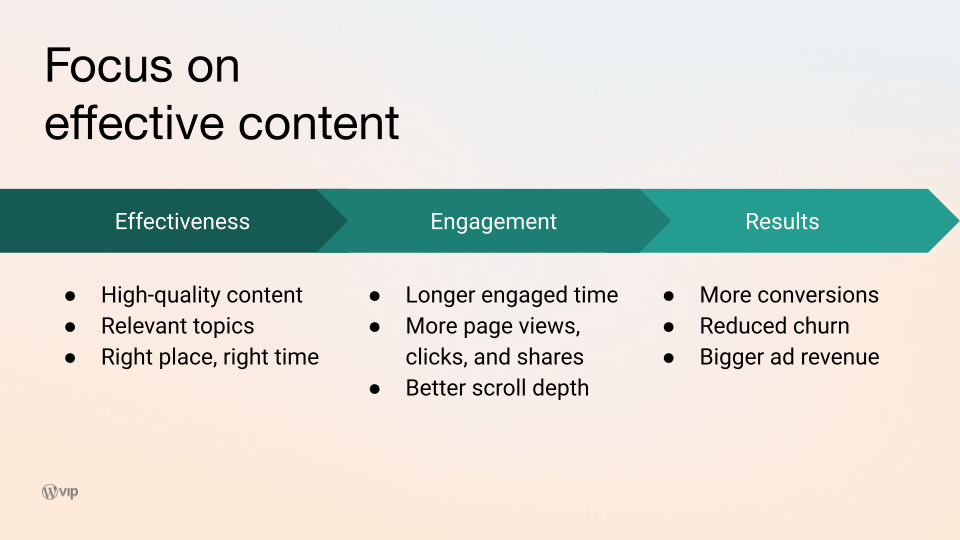
3. How do I know how a story is performing?
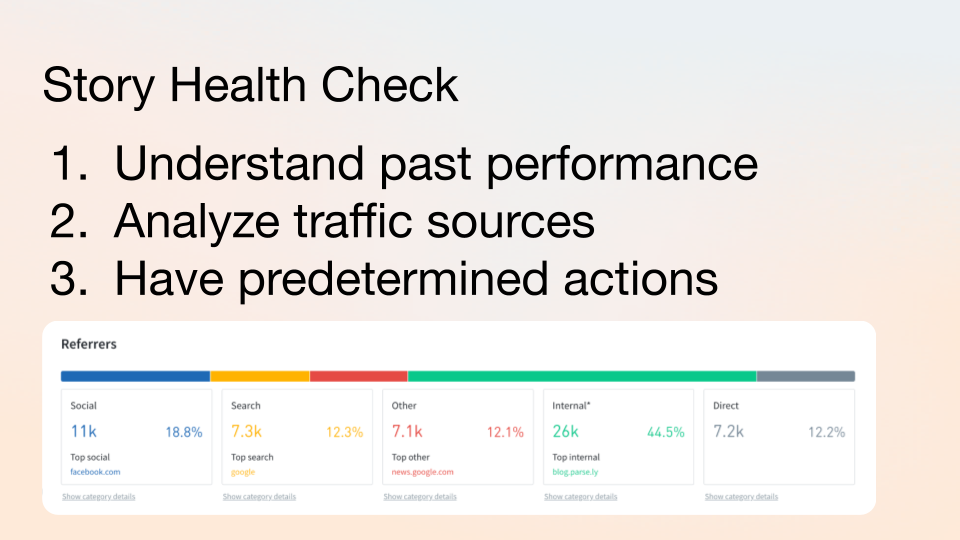
Conducting regular health checks on your posts is crucial to measuring and keeping on top of performance.
Benchmark your content to understand what your typical performance is for a given topic, author, and referral channel. Something like: “Generally, we get 20,000 pageviews and an average of 2:00 minutes engaged time; 15% of our traffic from social, 25% from search, 40% directly via email and others, and 20% from internal.”
Then, once you have benchmarks for what “normal” is, assign your team predetermined actions when they see any deviations from the norm.
No social traffic? Check with the social team to see if they’ve promoted the story (things do slip through the cracks). No search traffic? Open your SEO tool and optimize the post headers. You get the idea.
4. How do I leverage trending content?
So, you want to get more content bang for your buck. Engage in the conversation as it happens rather than waiting until the conversation is done.
Establish a system of detecting trends and then creating predetermined, follow-up actions based on your findings. Check social interactions and have your team comment, share, etc., to increase engagement. Set up alerts for what’s trending and schedule regular reports; encourage your writers and editors to do the same. Get in the habit of checking data right after publishing a piece.
Examples of this in practice:
- “This story is getting decent traffic and engaged time, let’s do a follow-up article about a related topic.”
- “Lots of traffic on this piece, let’s make sure it’s optimized for SEO and add links to under-performing stories to drive traffic and recirculation.”
- “This story isn’t getting the attention we thought it would on social media. Let’s pull in the social team to revise the promotional strategy.”
Another best practice: establish performance expectations, like reaching a certain number of pageviews within 24 hours of publishing a story. This will help your team lean into data, rather than always second guessing. Having set guidelines helps people understand the role different stories play and how to do their job more effectively.
5. How do I improve reader loyalty?
Conversions most often come from returning visitors. So the goal is to keep people on your site longer and get them to return more often. But traffic, engagement, and recirculation are sometimes hard to piece together.
Let’s use some specific examples.
Story A
“This post has lots of traffic, but engagement and recirculation are low.”
The problem: You’re targeting the wrong audience. People are visiting your site and not finding what they want.
The resolution: Promote the content through different channels or possibly a different format, to reach the right audience. Try a different headline or featured image. Additionally, if most of this traffic is from search engines, move the “answer” for their question higher in the piece, followed by an engaging section to keep them reading.
Story B
“This post has lots of traffic and good engagement, but recirculation is low.”
The problem: There’s no incentive for the reader to stay on your site.
The resolution: Add related links and an engaging CTA throughout the piece.
Story C
“This post has average traffic, but great engagement and recirculation.”
The problem: It hasn’t reached enough people.
The resolution: Promote the story in more places, and see if the rates hold up. If they do, you know the quality of content is good but it may have a more niche audience.
6. How do I identify underperforming content?
There are two main ways to pinpoint content that needs attention.
Bottom Listing Report
Parse.ly includes a Bottom Listings Report that quickly shows what isn’t working. This view creates an easy way to identify content that is underperforming compared to other pieces on your site.
Benchmarks
If your analytics tool has a benchmarks view, check what’s underperforming based on author, topic, tag, section, etc. You can also benchmark your own traffic, if needed.
Identify content consistently at the bottom. Where do those stories fall short? Weak or lax promotion? Not enough relevant content? Absent SEO?
Once you’ve targeted the problem with a piece, adjust accordingly and follow up on performance periodically to ensure your changes made a difference.
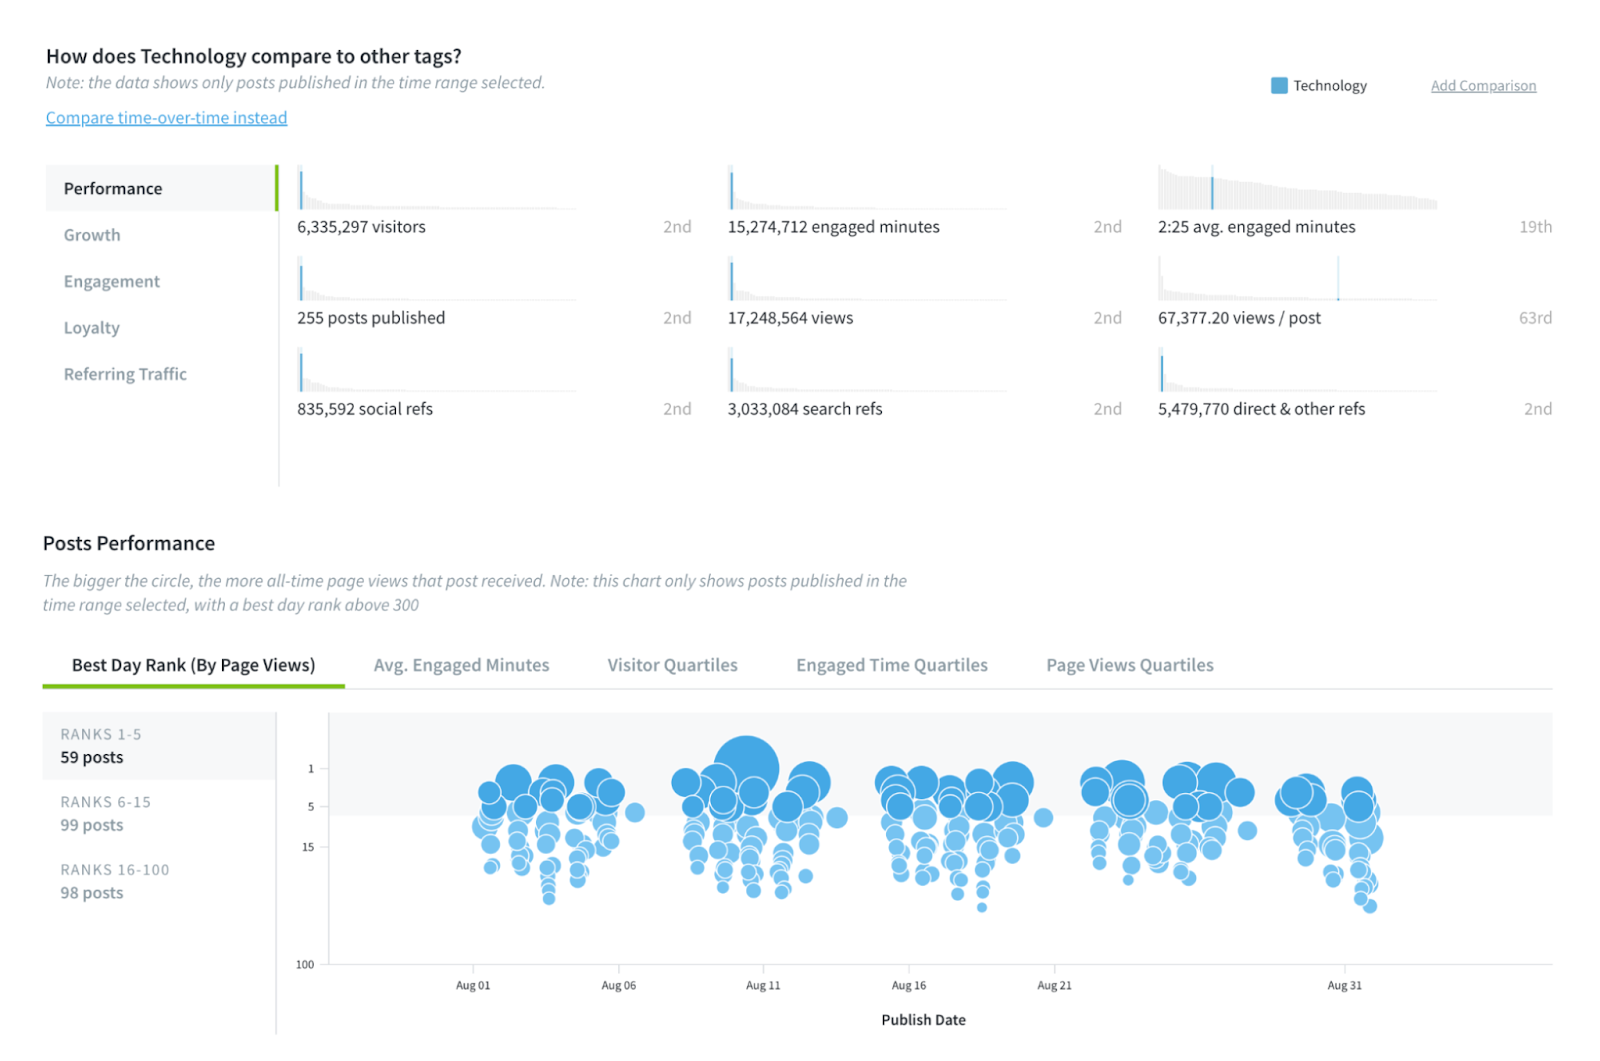
Parse.ly’s benchmarks view: The larger the bubble, the more pageviews the piece has.
Final thoughts
These strategies are not one-size-fits-all. Each team’s needs will differ, so it’s important to tailor your workflows to your unique team dynamic. That’s why having an intuitive, user-friendly content analytics tool like Parse.ly can help your entire team buy into the data mindset.
Note: This piece was originally presented at ONA 2022 by myself and Doyle Irvin. Watch the full session below, and learn why media companies need real-time content analytics.