Six lessons we learned from our content marketing last year
We love when people read our blog. We do! Thank you for being here. Just like our clients, we use content marketing analytics data to learn about what you pay attention to – and what you ignore. In this post, we’re sharing what the six lessons our 2018 data taught us about our audience, and how we’re using it to shape our content efforts in the coming year.
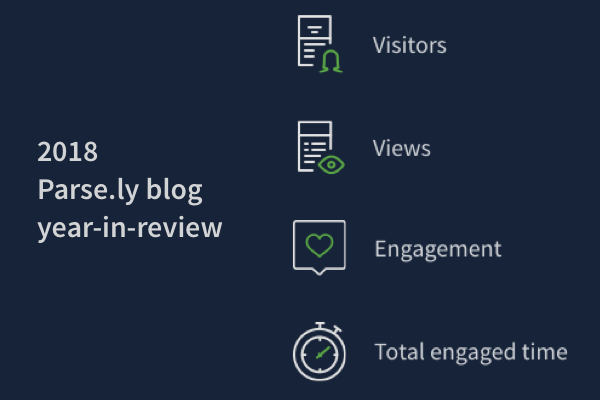
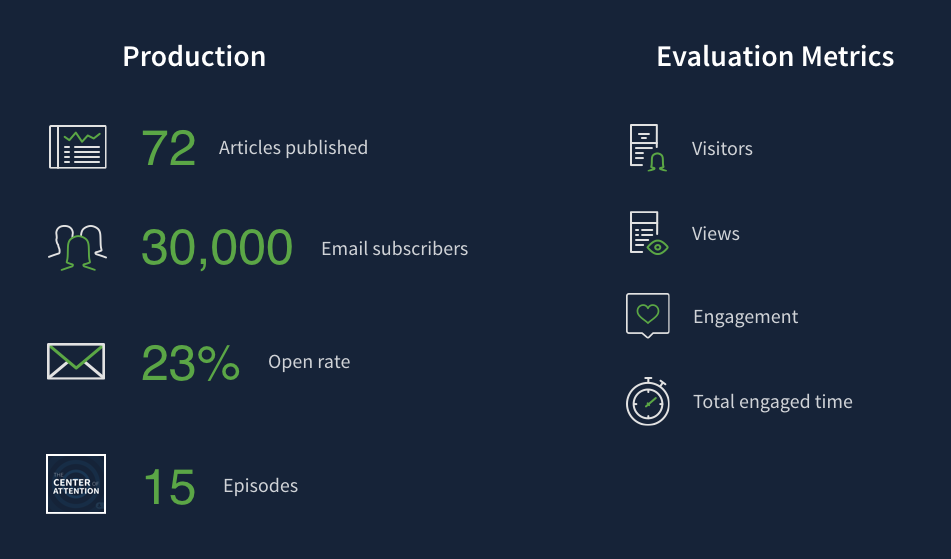
First though, some stats to give you a sense of our operation. In terms of output, in 2018 we published 72 articles (about 6 a month). Twenty-seven of our posts shared insights from our network data, which was our best performing section across every metric (views, visitors, engaged time, and social engagement). We produced 15 podcast episodes of The Center of Attention. Our newsletter, which we re-launched in August, has just under 30,000 subscribers and an open rate of 23%.
What were the lessons we learned about these efforts?
1. Focusing on engagement in the newsletter matters, as does frequency.
For years, we’ve sent out a blog newsletter on a bi-weekly basis. Sometimes that cadence would slip to every three weeks, and then even to monthly. We’d include the most recent posts, some stock photography, and short descriptions of them. Pretty standard stuff.
Over the summer, we asked ourselves, would anyone really miss this if it was gone? And if not, why are we doing it? We took a few weeks to do research. We looked at the open rates: they were declining. We thought about our goals of the newsletter: to tell the story of how we pay attention online. And we thought about our readers: what was the experience like for them when they received our email?
We had the opportunity to talk to a lot of really successful newsletter editors, and similar advice kept popping up: the inbox is a personal space and a crowded one. What were we really saying to people, and what did we want hear back from them?
Our re-launched newsletter includes a note from our editor breaking down the main story. We decided that click rates aren’t important to us, loyal readership is, so we designed the newsletter so you only click if you want to continue reading more. We now send it weekly, but only if there is something we feel is worth sharing. We reduced the number of links per newsletter.

We also started to have some fun! We hosted a trivia game. We sent a pizza to a reader. We made a list of other newsletters you should subscribe to.
The result of this update ended up boosting in traffic. Twice the amount of traffic to our blog came from the newsletter tin 2018 than in 2017. We plan on investing more in our newsletter and finding ways to grow it even more this year. If you’re new here – you should subscribe!
2. People really want to know what’s going on with Google and Facebook referrals (and we have the data that can help!)
Out of our top ten most read posts this year, six of them were about the referral traffic trends from Google and Facebook. The single most popular page on Parse.ly’s site is our referral dashboard, which was cited 495 times this year in other people’s stories about referral traffic trends.
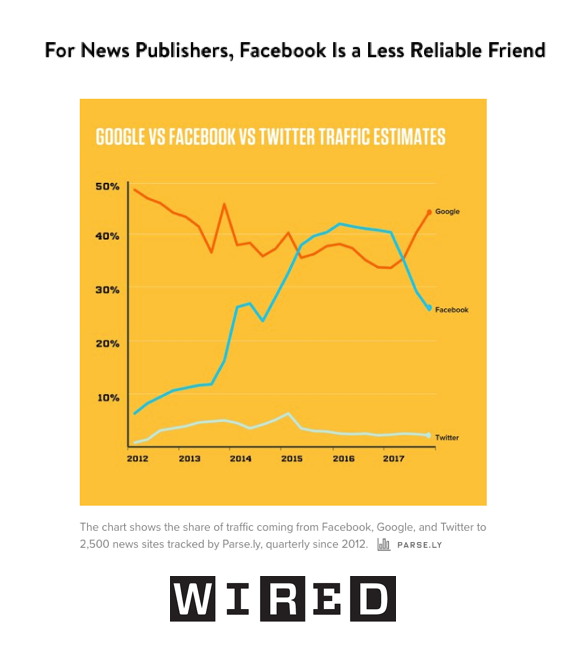
Wired Magazine covered Facebook and Google referral data in March 2018.
This confirms a theory we had years ago: that our data could be used to help the industry at large. Our aggregate, anonymized data set includes first-party tracking from thousands of high-traffic content-based websites. It continues to be the main source of information for our content strategy. (In fact, we believe in this so much that this year we launched Currents, which makes that data available directly to anyone!)
When Facebook announced in January of 2018 that it changed the algorithm to send less traffic to publishers, our data showed it had been happening for months already. These decisions and trends from referral sources impact people and business creating content and trying to reach audiences. This year, we want to move beyond the “duopoly” to highlight more non-Google and Facebook referral sources too though in 2019. Expect to see more from us on LinkedIn, Reddit, Pinterest, Flipboard and other traffic sources.
3. Newsletters are becoming a more valuable marketing channel
Not only did we see success with our own newsletter, it seems many people are interested in learning how to create compelling newsletters. Our most read blog post of last year: “3 stats that prove just how valuable newsletters are.”
The audience for this article also includes the most new visitors of any article to our site. This blog post goes beyond the audience we’ve cultivated, attracting a new audience of people highly interested in newsletters specifically.
The post saw the highest traffic from Google. It appears in the top three search positions for “newsletter statistics” and “newsletter stats.” However, it also sees strong traffic from Twitter, LinkedIn, and in a very meta-twist, from other people’s newsletters.
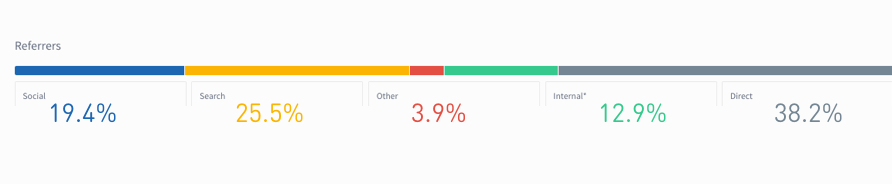
The traffic breakdown by referral type to “3 stats that prove just how valuable newsletters are.”
4. Not everyone sees what we put out the first time we distribute it
We made an effort this year to work smarter, not harder. This concept isn’t rocket-science, but I underestimated how effective it could be. I see everything we put out, and I worry we might sound repetitive if we share information more than once. My biggest lesson this year was: just because I’ve seen it before, doesn’t mean our audience has!
We refreshed older content and updated it. We took content that lived in other forms, like webinars or event presentations, and turned them into blog posts and slideshares. We summarized data and reviewed how our data predictions aged (it turns out, we were right about the pivot to video not being a great idea). Our audience metrics showed us that even if we feel like we’re repeating ourselves a little, plenty of people appreciate that we made sure they didn’t miss anything important.
For example, and one that SEO-pros will be familiar with, a post originally written in 2014 on article recommendations still saw a small amount of Google Search traffic. Though the landscape hasn’t changed dramatically, there was some information that needed updating, and the graphics were very outdated. A quick infographic refresh and a second pass at the copy later, we republished and saw search traffic increase by 100%.
We use our evergreen reports to identify good opportunities for posts to update and make sure that all of our presentations get their key data points summarized for the blog.
5. Assessing the “misses” and changing course: using data to cull what’s not working
While we’ve highlighted what worked this year, we also had efforts that weren’t as successful. Spending more time, energy, resources on the efforts mentioned above means we also have to decide what not to do. It’s probably our least favorite task but we believe it’s crucial to our success for next year.
Stories that we had hoped would get more traction included: topics readers read the most about right before the midterms, the relationship between movie reviews online and box office returns, and the continued interest in the #metoo movement in media. Across every metric we use to evaluate stories, these were the least successful.
As much as we loved putting these together, we had to recognize that these stories just didn’t interest many people. What we decide not to do impacts us just as much as the things we decide to do.
6. The “Wouldn’t it be cool if we…” lesson
It’s hard to evaluate stories we never told in the first place. While we want to build on what we know our audience wants, we also want to experiment and enjoy the work we’re doing. We want to say, “wouldn’t it be cool if we…” and then try those ideas out. We want people to know what Parse.ly is really about, which the data shows we didn’t talk about a whole lot last year.
In 2019, wouldn’t it be cool if we shared more about the moments at Parse.ly that shape who we are as a company? Wouldn’t it be cool if told the stories of people and companies doing really well with digital media and content? Wouldn’t it be cool if we made sure that our content highlights voices and stories that might typically go unheard?
This year, we’re looking for more of those stories to tell. We’ll show what works here, and what doesn’t, with this post being part of that effort. Our distributed team, our culture, they make up who we are here, and while we want to avoid navel-gazing, we hope that other companies might be interested in the lessons we’ve learned along the way.
Here’s to interesting and successful content in 2019, we hope you’ll join us for it! (You can sign up in that little box on the bottom of your screen!)