Hooked on Data: Overcoming the High Demand for Content

Raise your hand if you don’t have enough time in the day to make data-driven content decisions.

We’re betting that’s most of you. Especially anyone working in media where the expectation is to be the first, the best, and the shiniest. We see this frustration with our media clients all the time.
But there is hope. Successful teams are getting past this hurdle. Let’s start our story by spotlighting a Parse.ly client who felt similar pain and solved things with data.
Just one month after the Network N redesign, traffic was up 50% and revenue was up 75%.
Network N’s data-driven strategy
Network N is a gaming media company with multiple brands and websites. All told, they get 60 million unique visitors a month.
One of their brands, The Digital Fix, found themselves on the “content hamster wheel”—so busy they never had time to stop and smell the proverbial strategy roses. It was just publish, publish, publish, at an unsustainable pace.
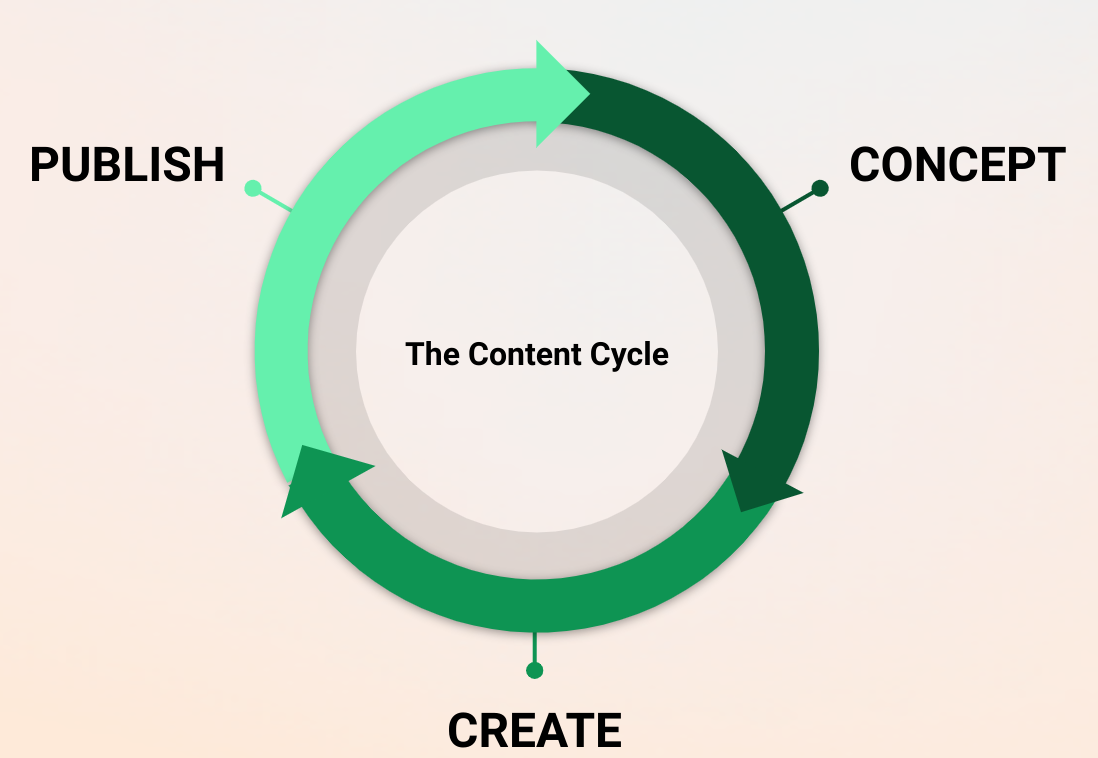
Eventually, it dawned on them. They needed to take a step back and consider their historical content data. Instead of endlessly chasing the news cycle and throwing out articles, they decided to pause and analyze performance over the past year.
Here’s what they found.
Editorial content was doing extremely well in terms of keeping readers actively engaged, but their site did not effectively surface this content. And because most traffic came from people searching for their favorite games, readers would show up, read that one piece, then promptly leave.
Based on these insights, Network N redesigned their site to better recommend editorial content. Just one month after the redesign, traffic was up 50% and revenue up 75%—they were getting more traffic and monetizing visitors more effectively.
The pace of publishing had them work harder, not smarter. Stepping off the content hamster wheel allowed them to achieve their business goals.
The speed of publishing is out of control
Simply put, people can’t keep up with the current demand of publishing.
The results from our Content Matters 2022 Report tell us as much.
To meet that demand, we found that organizations want to increase their content budgets to hire more content creators to create more content.
But we also know content marketers are tired, trapped on a hamster wheel, often looked at as a content vending machine. In such an environment, is it any wonder that it’s hard to keep up with the speed of publishing and feel confident in the quality of content being promoted?

Why does the need for content feel so frantic? How did we get here?
Operating in a low-loyalty environment
Interest in news has fallen 12% over the past few years. The way people access news is shifting from owned channels to (multiple) channels you have less control over. The result? Your consumers’ attention landscape is heavily fractured, leading to a low-loyalty environment where consumers expect a custom, personalized experience and get frustrated with your brand when they don’t get it.
Besides fighting for market share, you’re fighting for basic interest in your product.
Welcome to the content hamster wheel. Unsure how to achieve publishing goals, you revert to what you know: working harder, publishing more, and hoping whatever spaghetti you throw at the wall sticks.

How can you break the cycle and catch your breath? You can’t if you’re ignoring data.
Avoiding the content hamster wheel with data
Most people want to increase their publishing production, but many skip a crucial first step. Almost half of content creators don’t know how their content is performing in the first place, leading them to make content decisions in the dark.
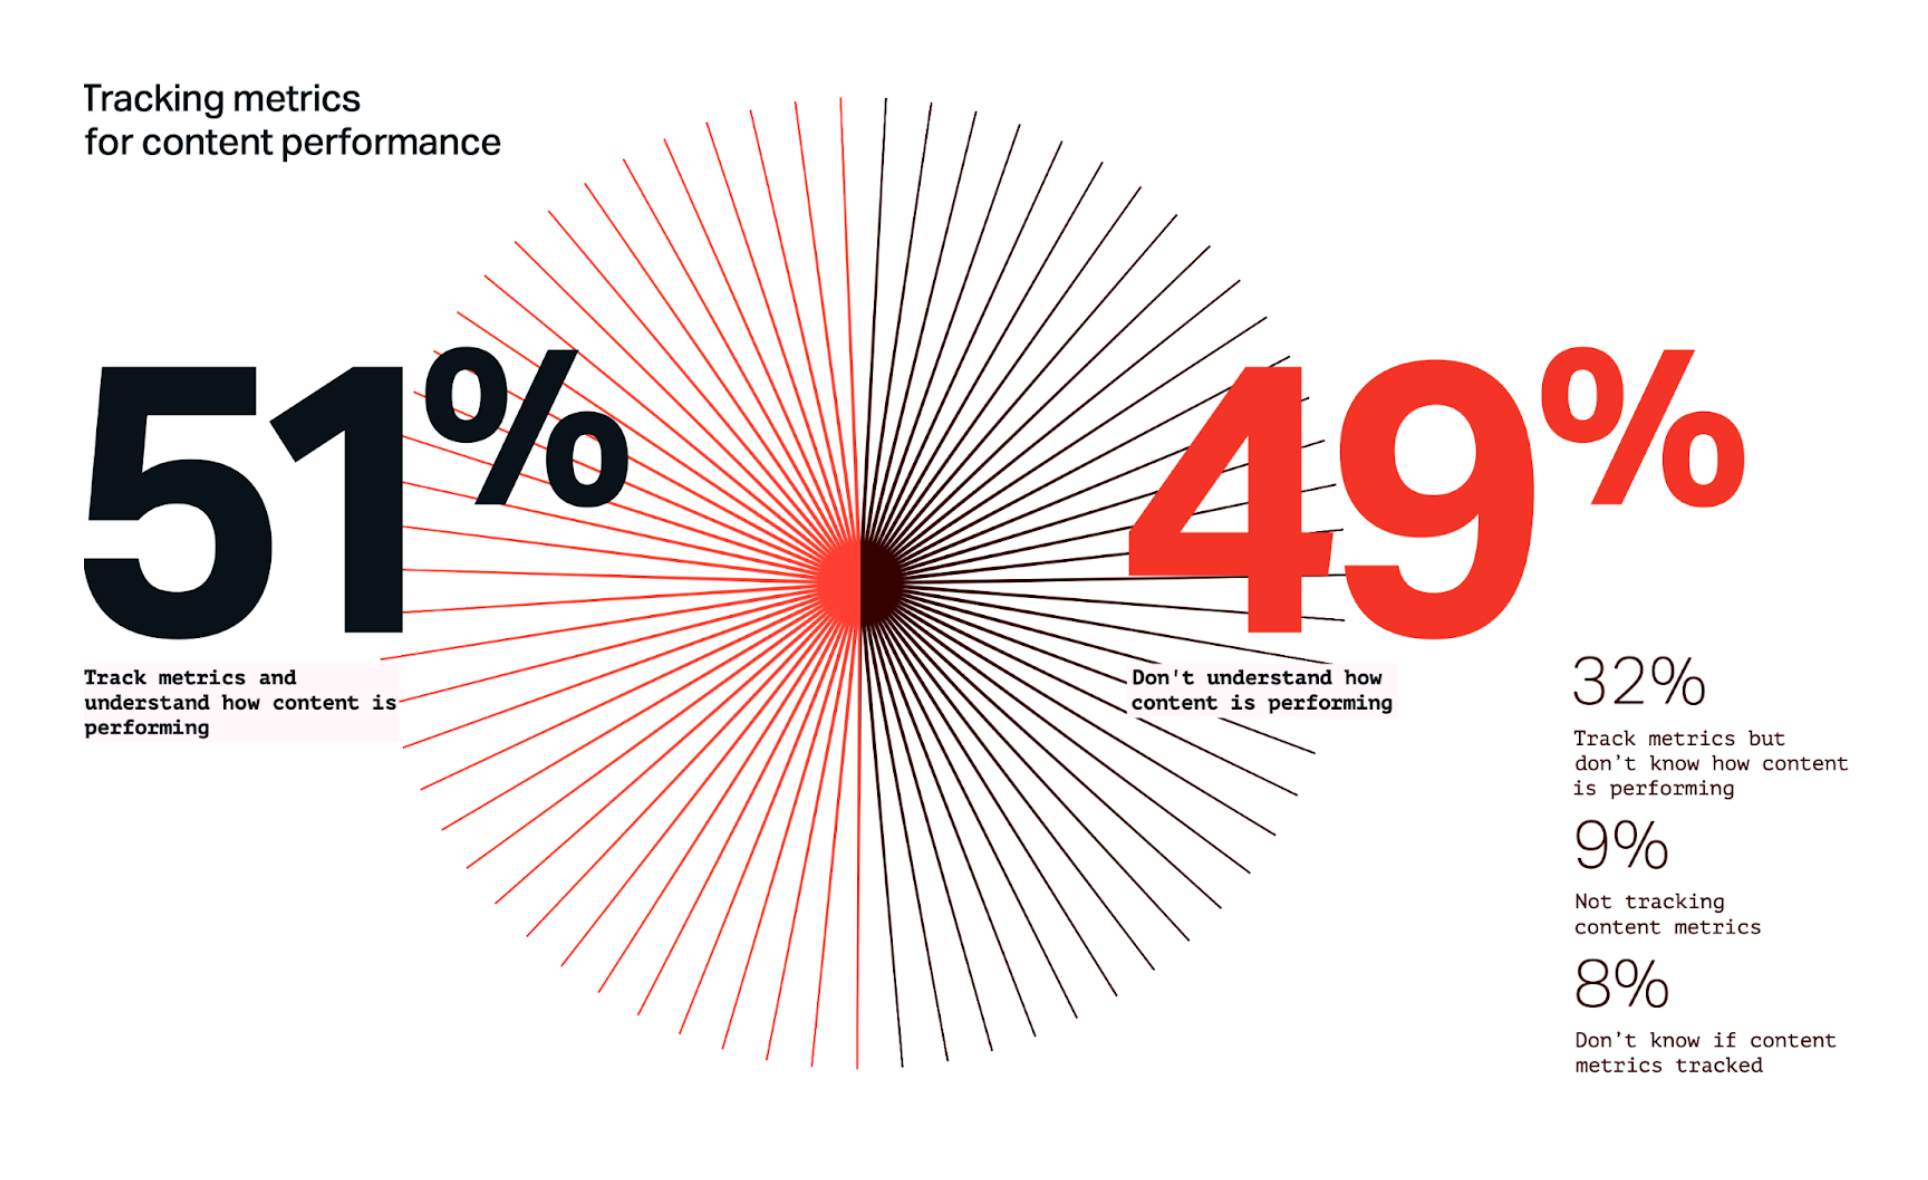
How can you make informed publishing decisions if you don’t fully understand what resonates with your audience? (Hint: you can’t…) Data is the cure for the common content hamster wheel.
Get more out of each piece you create by stepping away from the publishing cycle to analyze performance. If you increase production without a solid, data-driven strategy, your workflows will suffer. And that ROI your management wants to see? Forget about it.
The key to giving your reader the personalized content experience they want is understanding them in the first place. Measuring your performance and analyzing data is the only way to do that.
Measuring performance does require real effort and a shift in mindset for many. But it doesn’t have to be painful or difficult.
Successful teams are investing in workflows that get people hooked on data to develop data fluency over time.
The marriage of people, process, and technology
It’s easy to tell when pieces fall flat (cue angry tweets) and to identify obvious spikes in traffic from viral stories. But there’s a huge middle ground between flopping and going viral.
Remember: non-viral, average-performing content contributes to your business, even if it’s not driving subscriptions or sign-ups. There’s actionable data you can pull from those pieces and ways to elevate stories. First, you have to find that data.
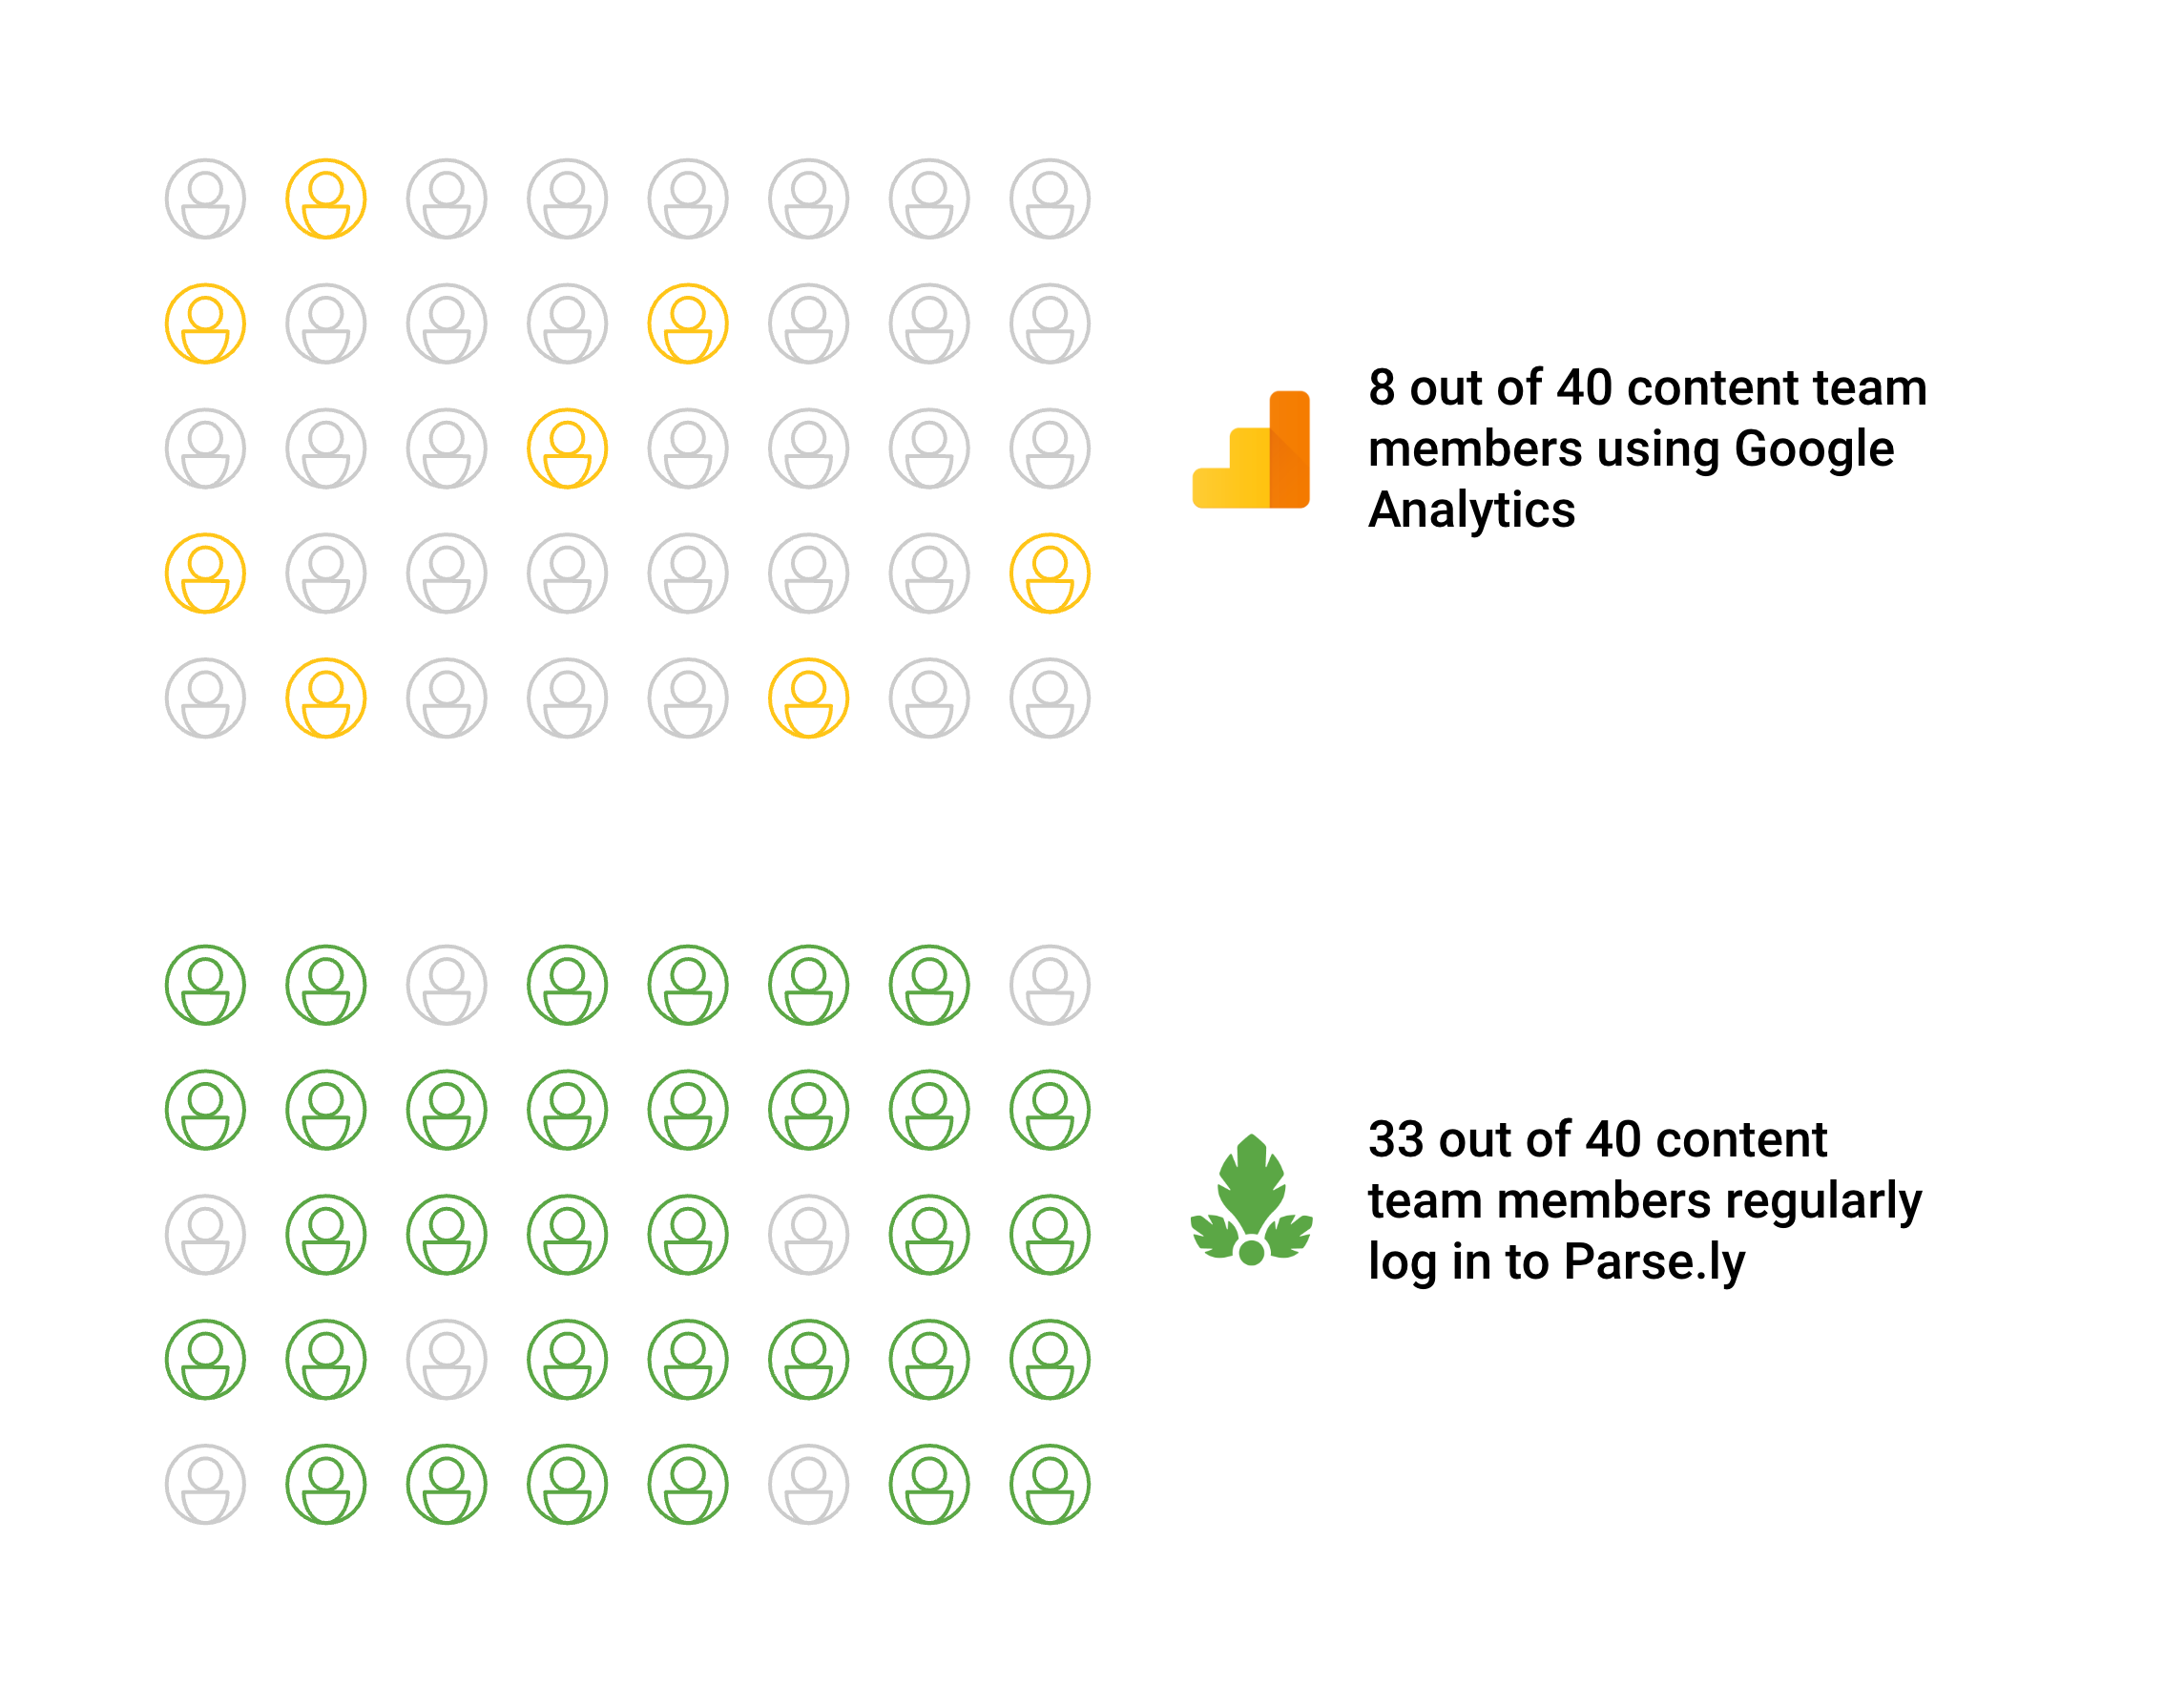
In our Content Matters report, we found teams are using two main tools to measure performance: Google Analytics (GA) and the built-in social media analytics found within each site.
Google Analytics is a given, right? But there’s a large barrier to entry for someone to use it, and use it well. In fact, we found that only 20% of content team members use GA. Of those, only 64% actually feel confident using it. If you do the math, that means only 12% of GA users can actually use it to pull real, meaningful insights.
As for social media, you’re probably only seeing surface-level, vanity metrics that don’t tell the full story. Plus, social reports are often segmented (not omnichannel) and only accessible by a few at most.

You have the data and know it’s important, so why aren’t you using it? Well, for most teams data is monopolized by a select few when it should be democratized to everyone on your team—the hallmark of successful teams, in our experience.
In talking with our media customers, we’ve identified three main trends for teams who are seeing the most growth and goal achievement.
Successful team trends
They expect more from their content.
Instead of getting sucked into the content hamster wheel, they’re looking at data and getting more mileage out of every piece they publish. They work on evergreen opportunities as much as possible and look at quality in addition to quantity.
They’re building whole-team data fluency.
These teams realize just having one or two “data people” and relying on them for insights is a broken system. It means most people end up not using data at all.
Instead of over-complicating their analytics process or trying to establish magical reports that solve all their problems, they’re doing the opposite: simplifying. They’re creating accessible systems and investing in tools and workflows that get every team member hooked on data to build data fluency over time.
They’re critical of martech promises.
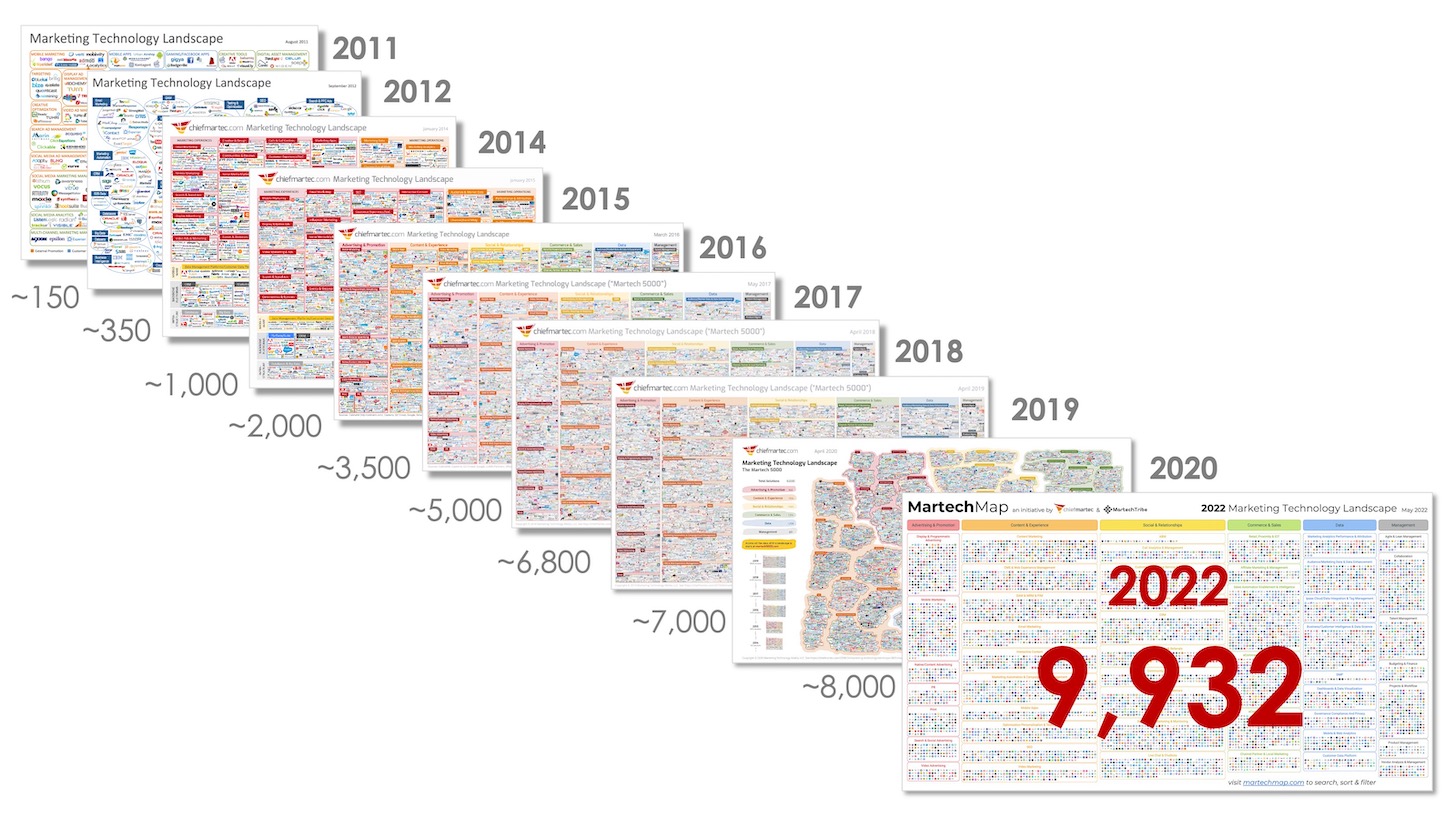
Over the past 10 years, the number of marketing technology tools has exploded, from 150 to nearly 10,000. Teams have been burned by the empty promises of companies offering flashy things like AI, but not providing real return. Instead of spending buckets of money on complex tools, they’re taking a critical eye to how a tool actually fit into their workflows. What will change and why? How will the team use it? What is the actual value?
Center your strategy on data
To follow the suit of these successful teams, marry your people, process, and technology in a way that prioritizes data at every level.
- People: Hire employees who are skilled with (or at least open to) data.
- Process: Identify metrics that truly impact your results; establish workflows that help your team analyze and interpret those results.
- Technology: Provide tools to access data easily.
We know this marriage works; we’ve seen it in action. Giving your entire team access to data helps them make smarter decisions, create better content, and ultimately achieve more results.
Ready to get your entire team involved in analytics?
Check out six easy workflows you can start using today.
This piece was originally presented at ONA 2022 by myself and Doyle Irvin.